Everything About Test Plan in JMeter
What is Test Plan of JMeter
Test Plan of JMeter is the container that holds all the elements and configurations necessary to execute a performance test.
Where we can define blueprint for how the test will be conducted, including what to test, how to simulate the request in functionality testing and load in performance testing , and how to measure the performance.
Key Components of a JMeter Test Plan:
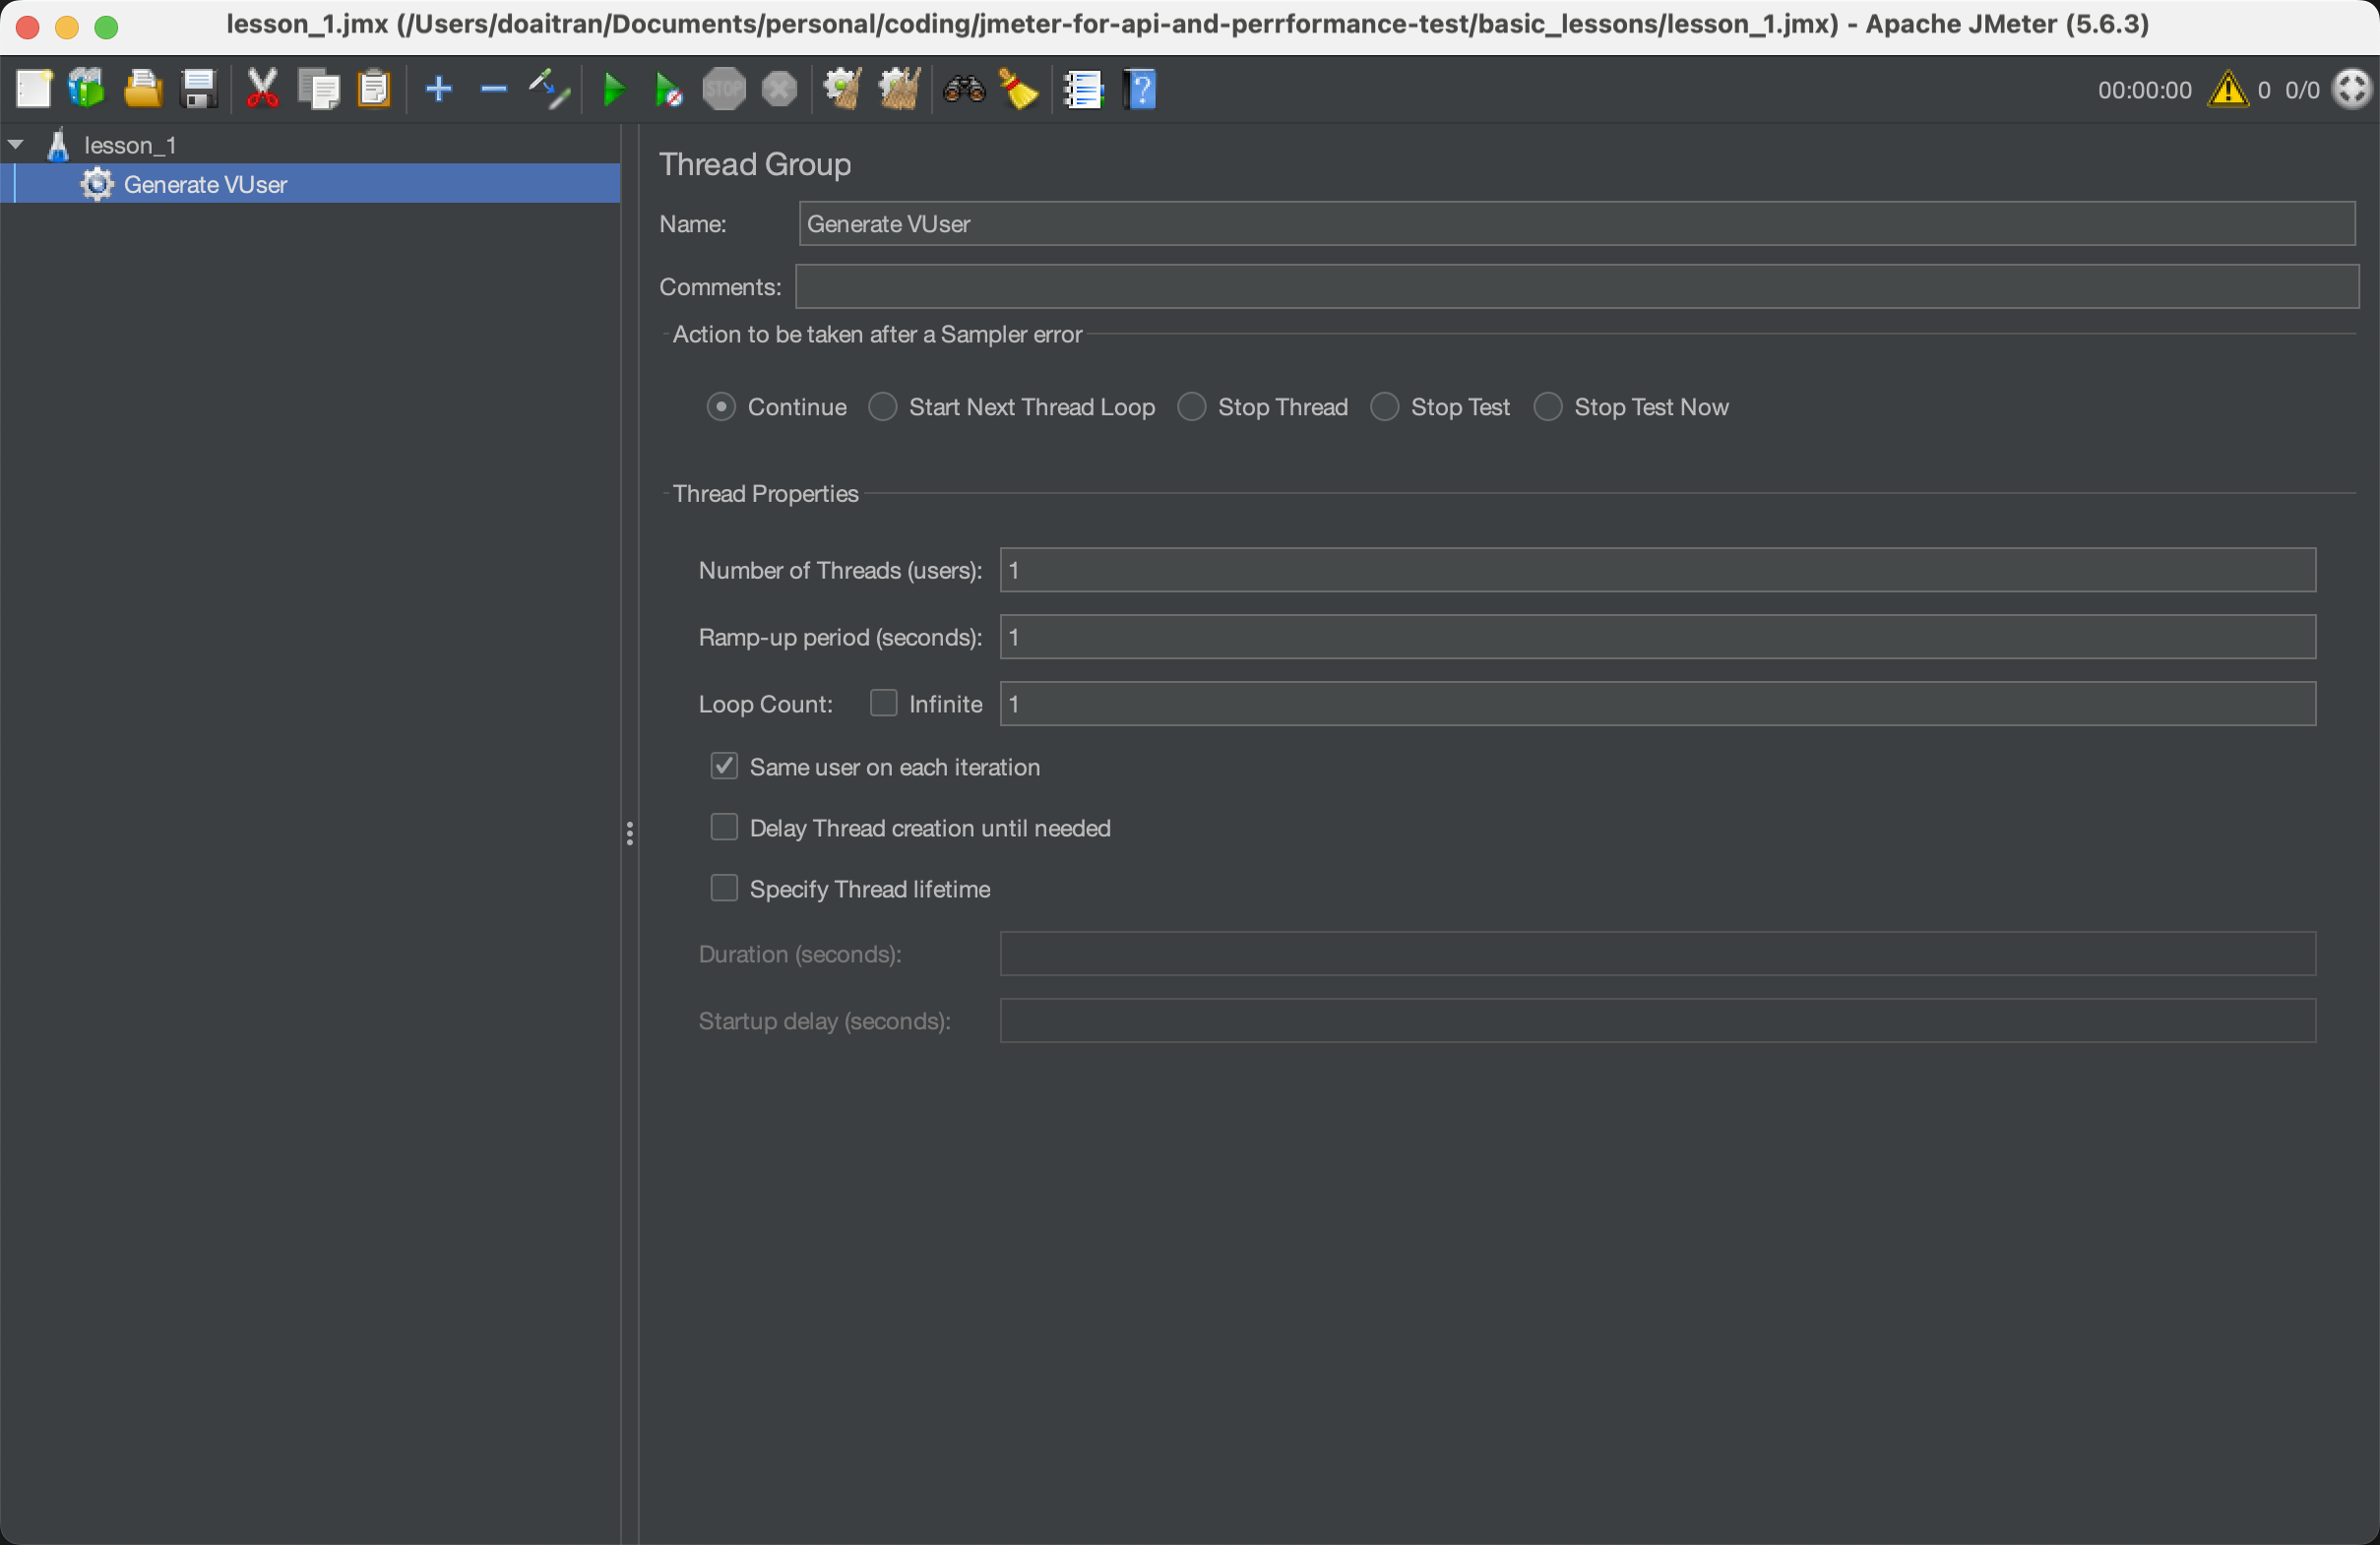
- Thread Group: Defines the number of users (threads), the ramp-up period (time to start all users), and the loop count (number of iterations).
- Samplers: Represent the actual requests that JMeter will send to the server. Common samplers include HTTP Requests, FTP Requests, JDBC Requests, etc.
- Controllers: Used to control the flow of the test. These can be logic controllers like If Controllers, Loop Controllers, and Transaction Controllers.
- Listeners: Collect and display the test results. Examples include View Results Tree, Summary Report, and Graph Results.
- Timers: Introduce delays between requests to simulate real user interaction more accurately.
- Assertions: Check if the responses received during the test meet the specified criteria. For example, a Response Assertion can be used to verify that a response contains a specific string.
- Config Elements: Provide configuration details such as default values for requests (e.g., HTTP Request Defaults), User Defined Variables, or JDBC Connection Configuration.
- Pre-processors and Post-processors: Allow you to modify the sampler or perform actions before or after a sampler is executed. For instance, a Regular Expression Extractor can be used as a Post-Processor to extract data from a server response.
- Test Fragments: These are reusable parts of a test plan that can be called from multiple places within a test plan using a Module Controller.
Basic terms about Test Plan, Thread Group, Sampler to Request and Listener in JMeter
Here is the main steps to get familiar with basic JMeter with HTTP test
- Open JMeter and start by creating a new Test Plan.
- Add a Thread Group to define the number of virtual users and how they should be simulated.
- Add Samplers under the Thread Group to specify the actions that users will perform.
- Add Listeners to collect and view results from the test execution.
- Use Controllers to organize and control the flow of these actions.
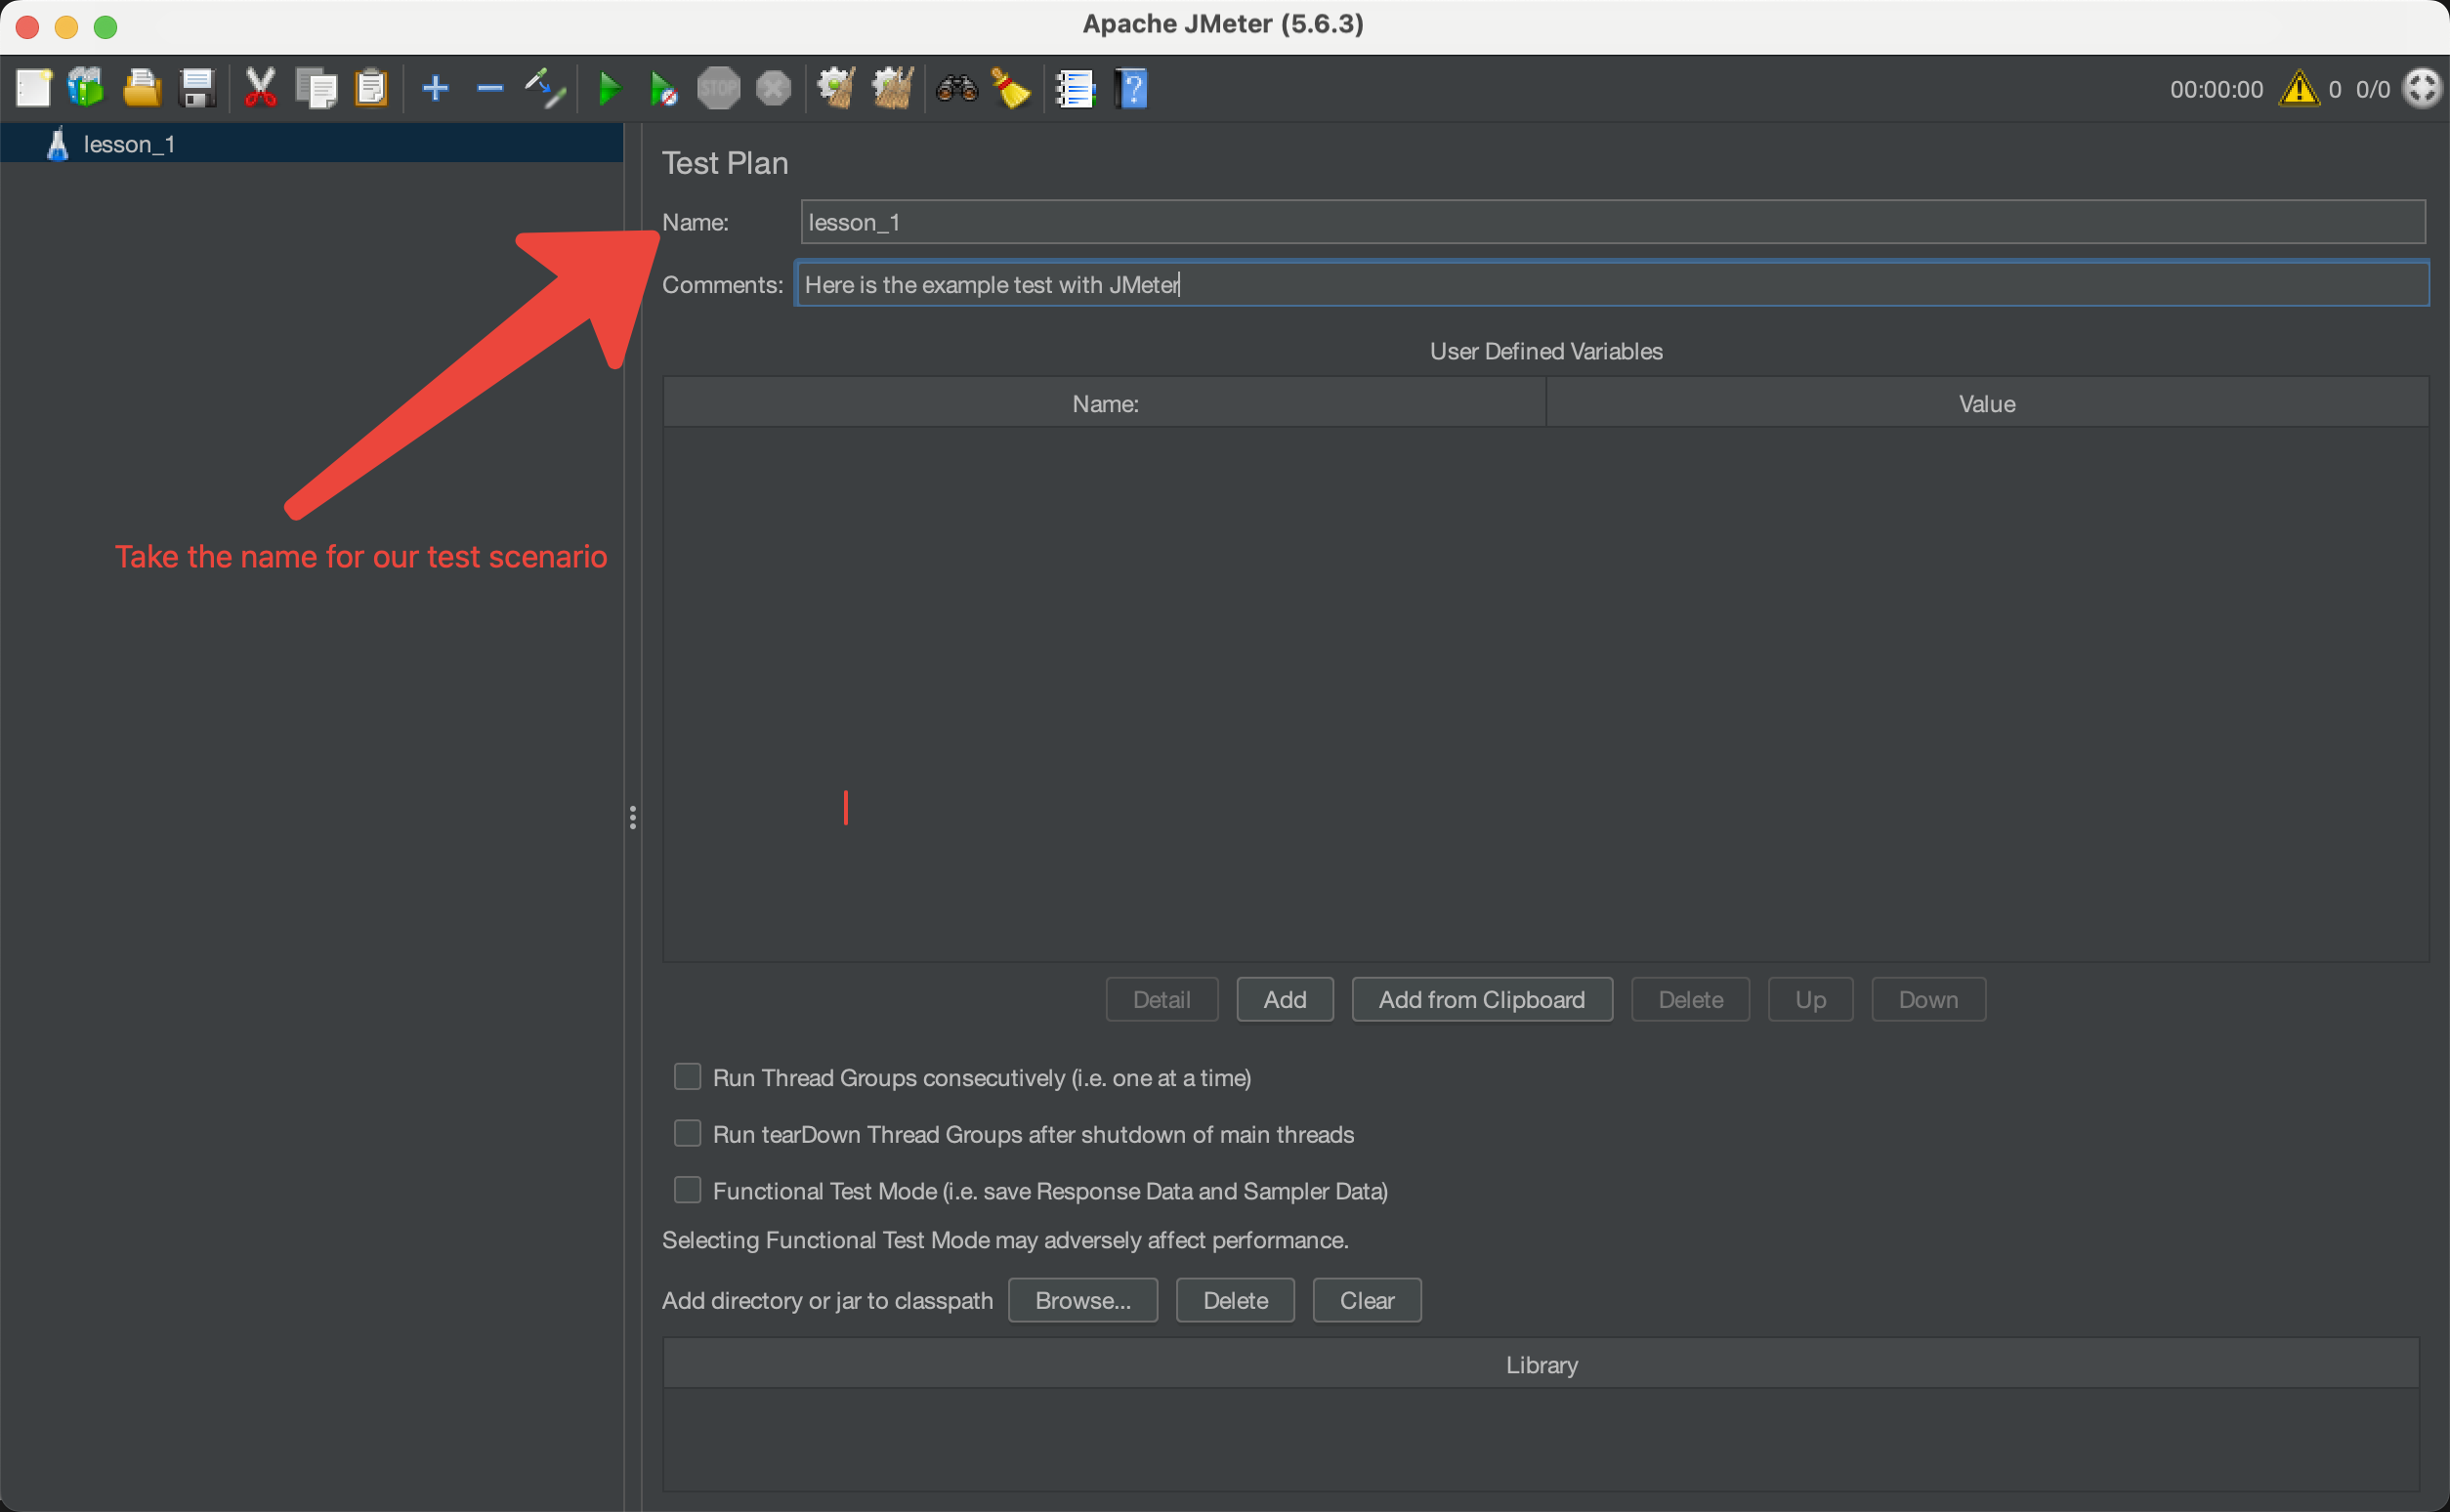
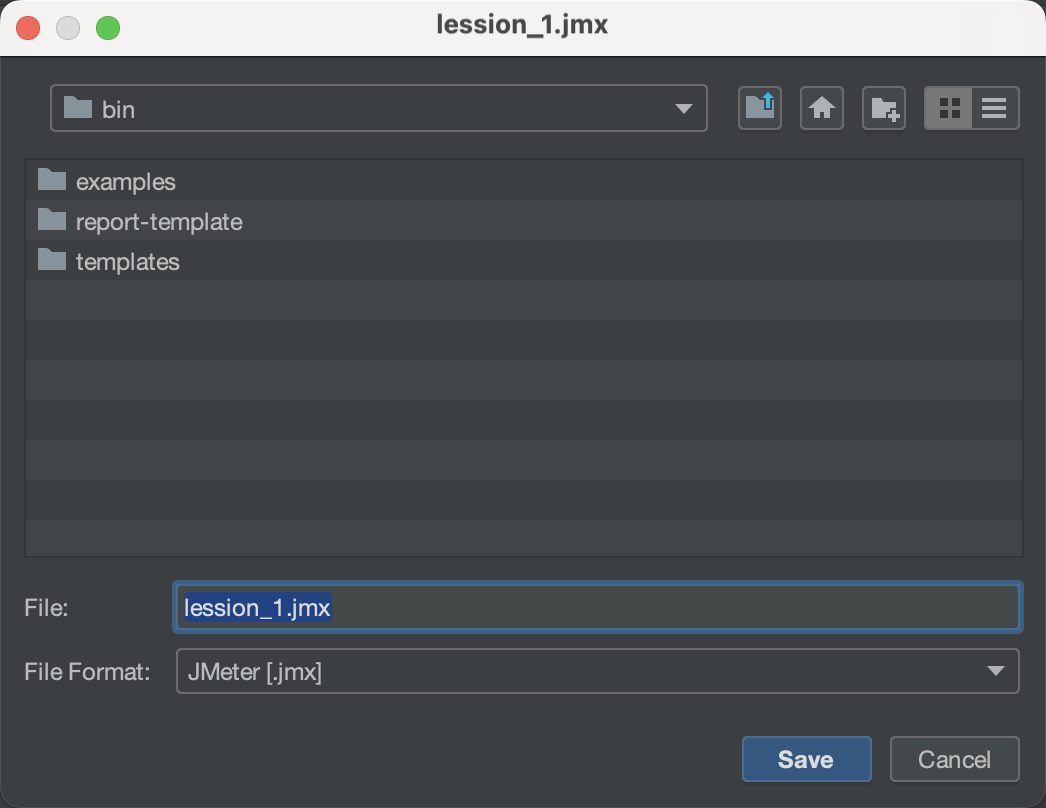
1. Create and take the name of JMeter script file
- When we save the test script of JMeter tool, the extension file is jmx file.
- On the JMeter UI, we can take name of our JMeter test script, where we save all test script details.
- Save the test script as JMX file
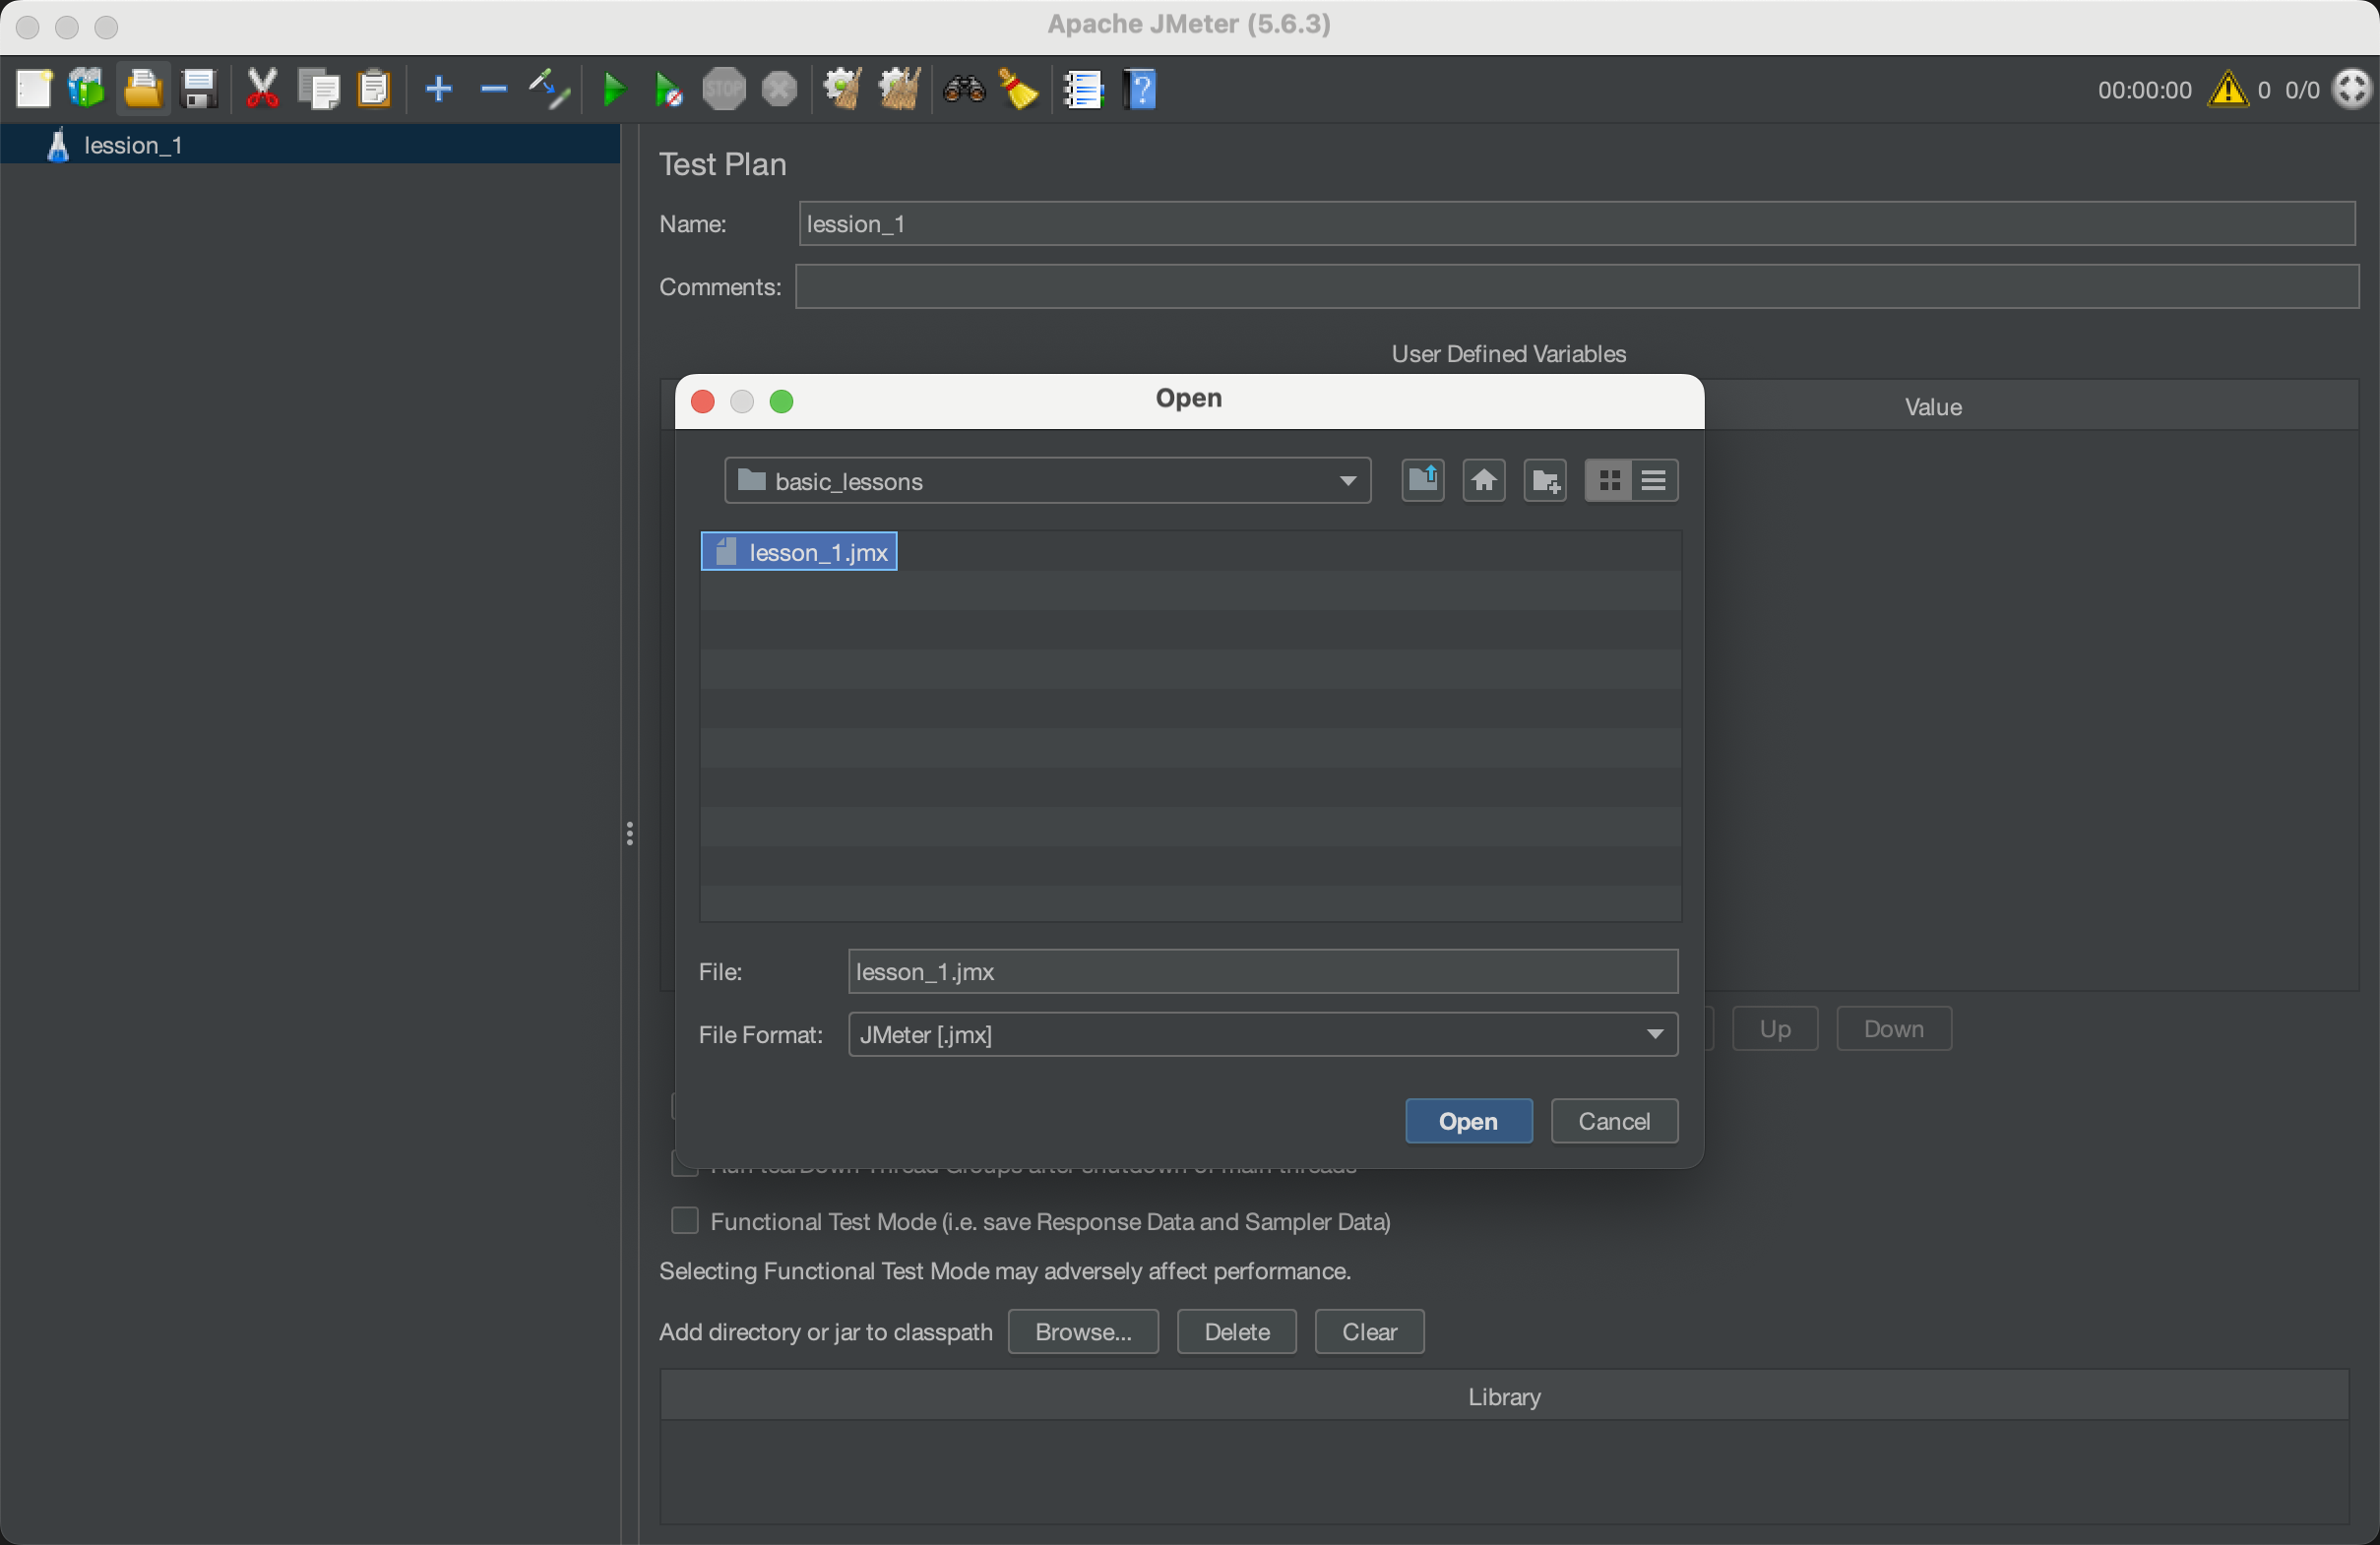
- And JMeter enables us to open the existing JMeter file by open the test script function.
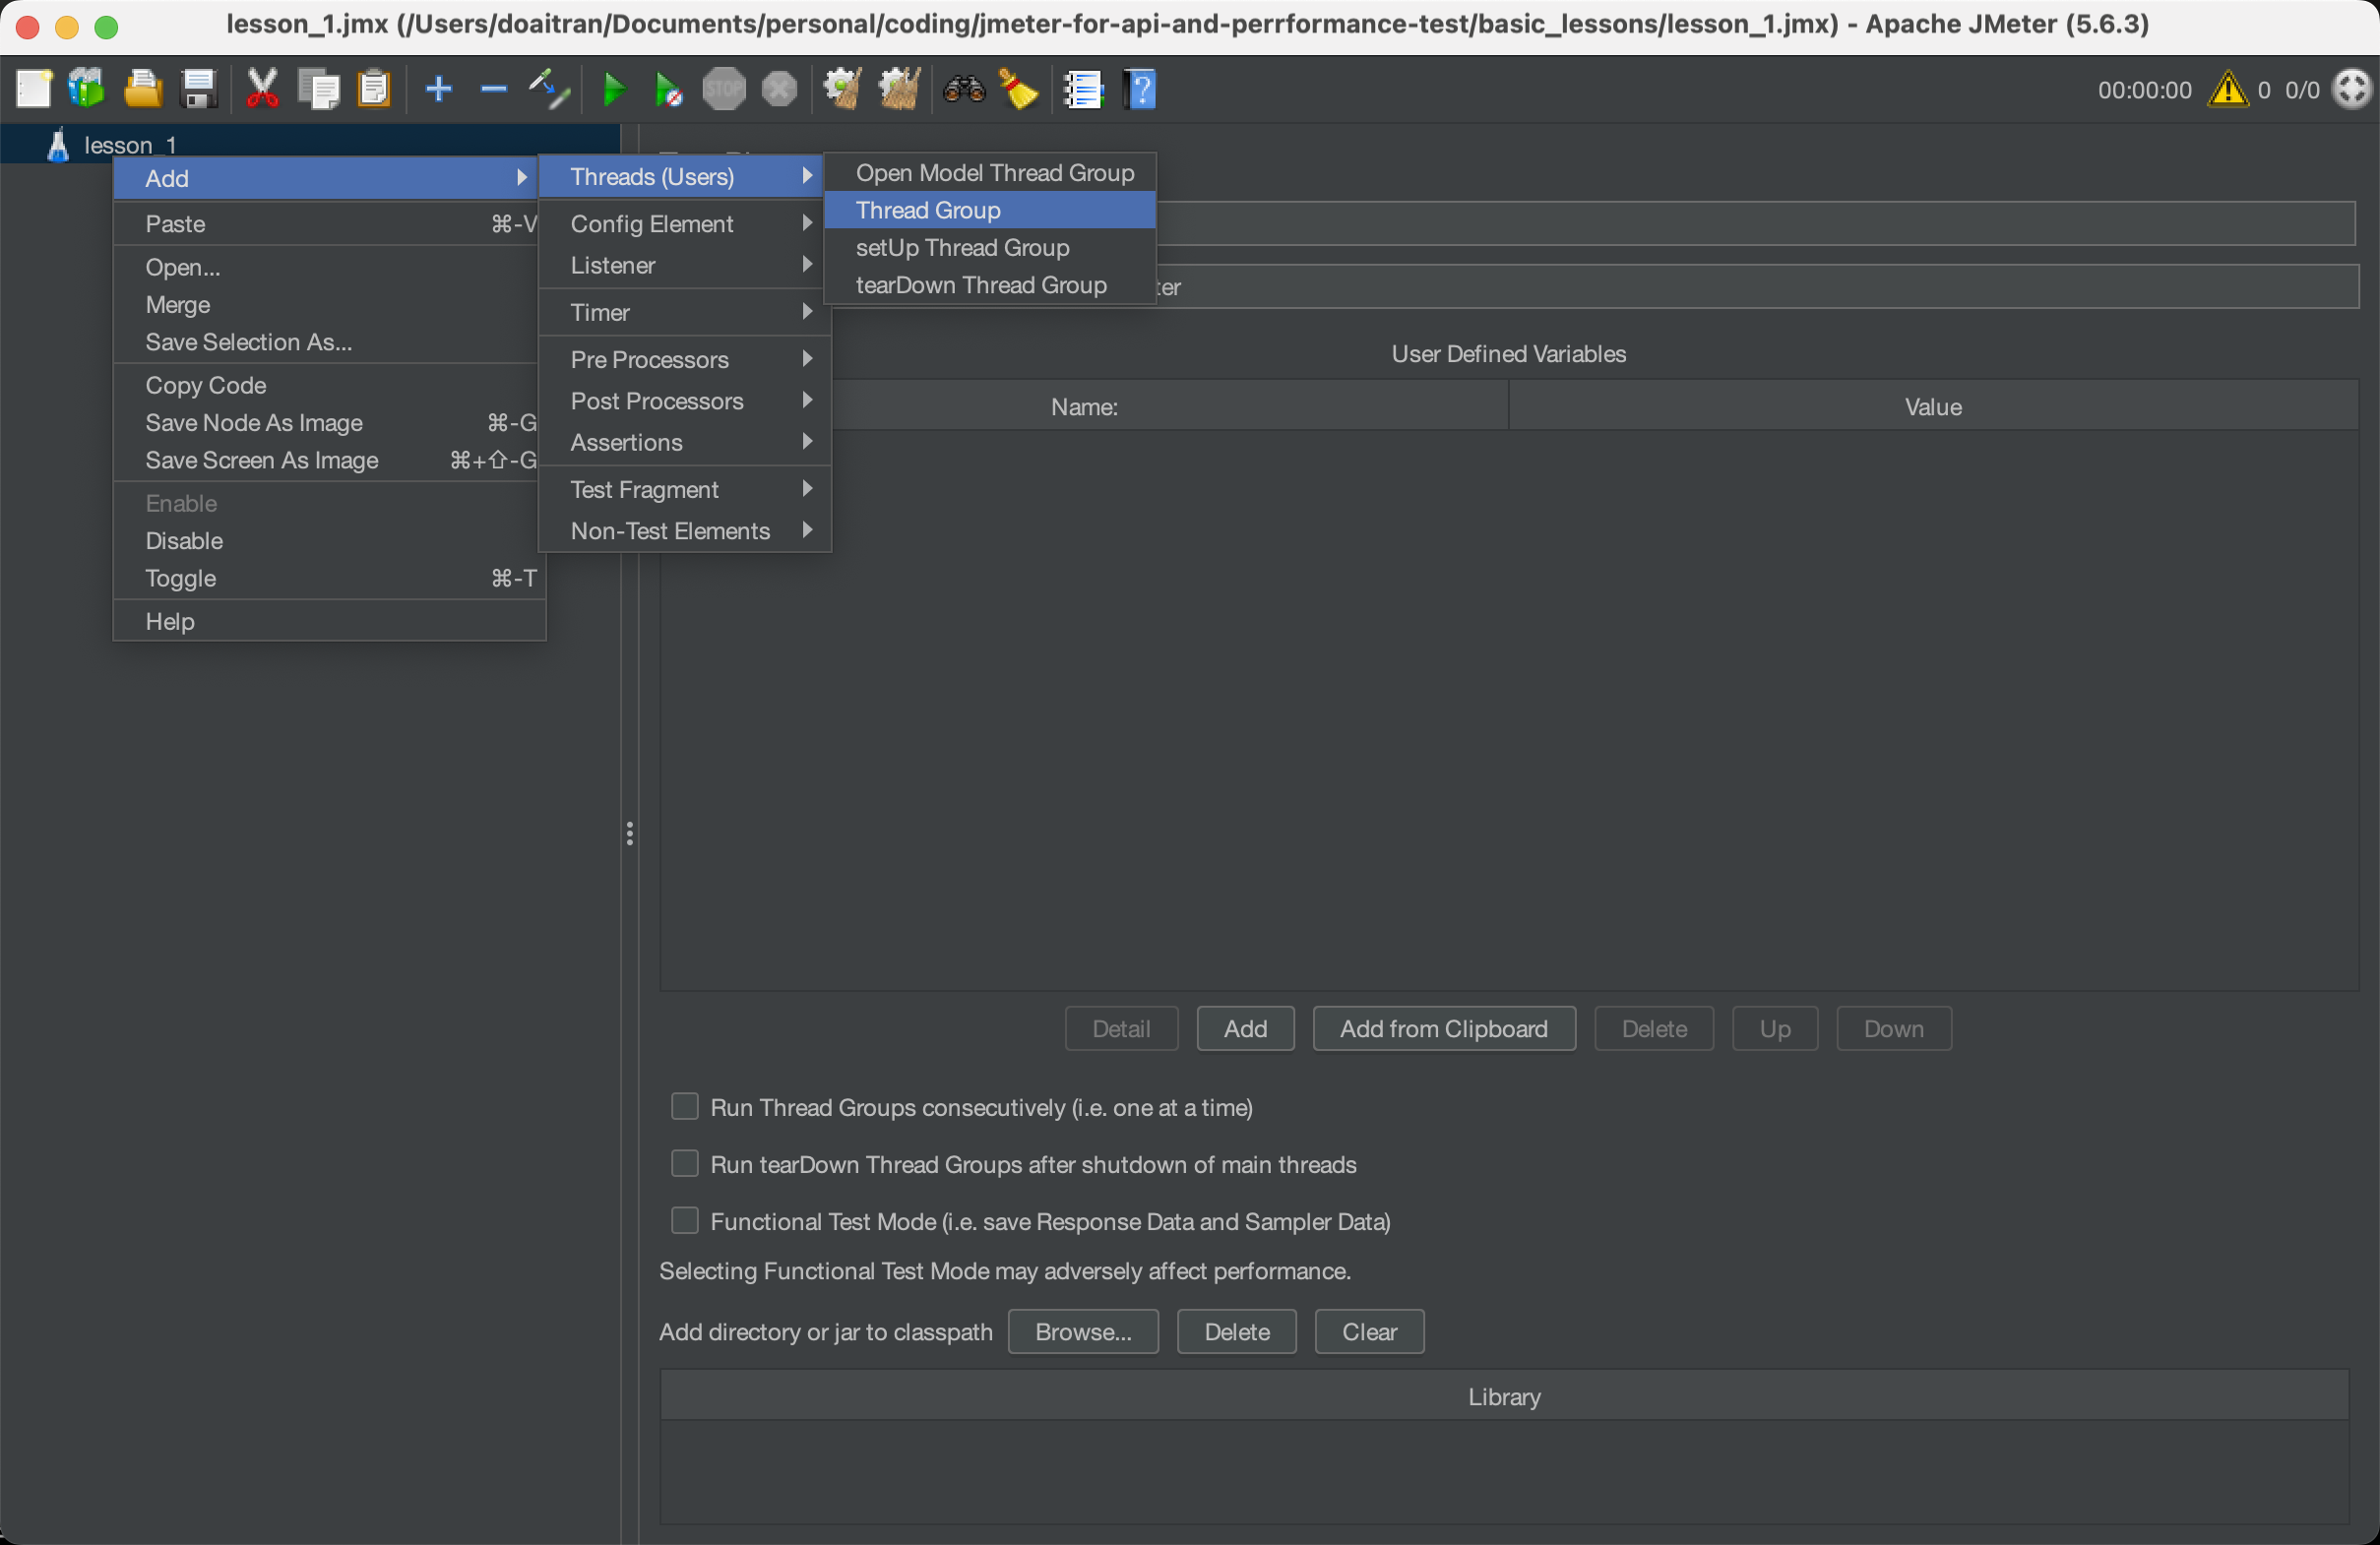
2. Creating a new thread
We can create the Thread Group by
- Right Click on Test Plan
- Select Add
- Select Threads (Users)
- Select Thread Group
We will have a thread group with detailed information as below:
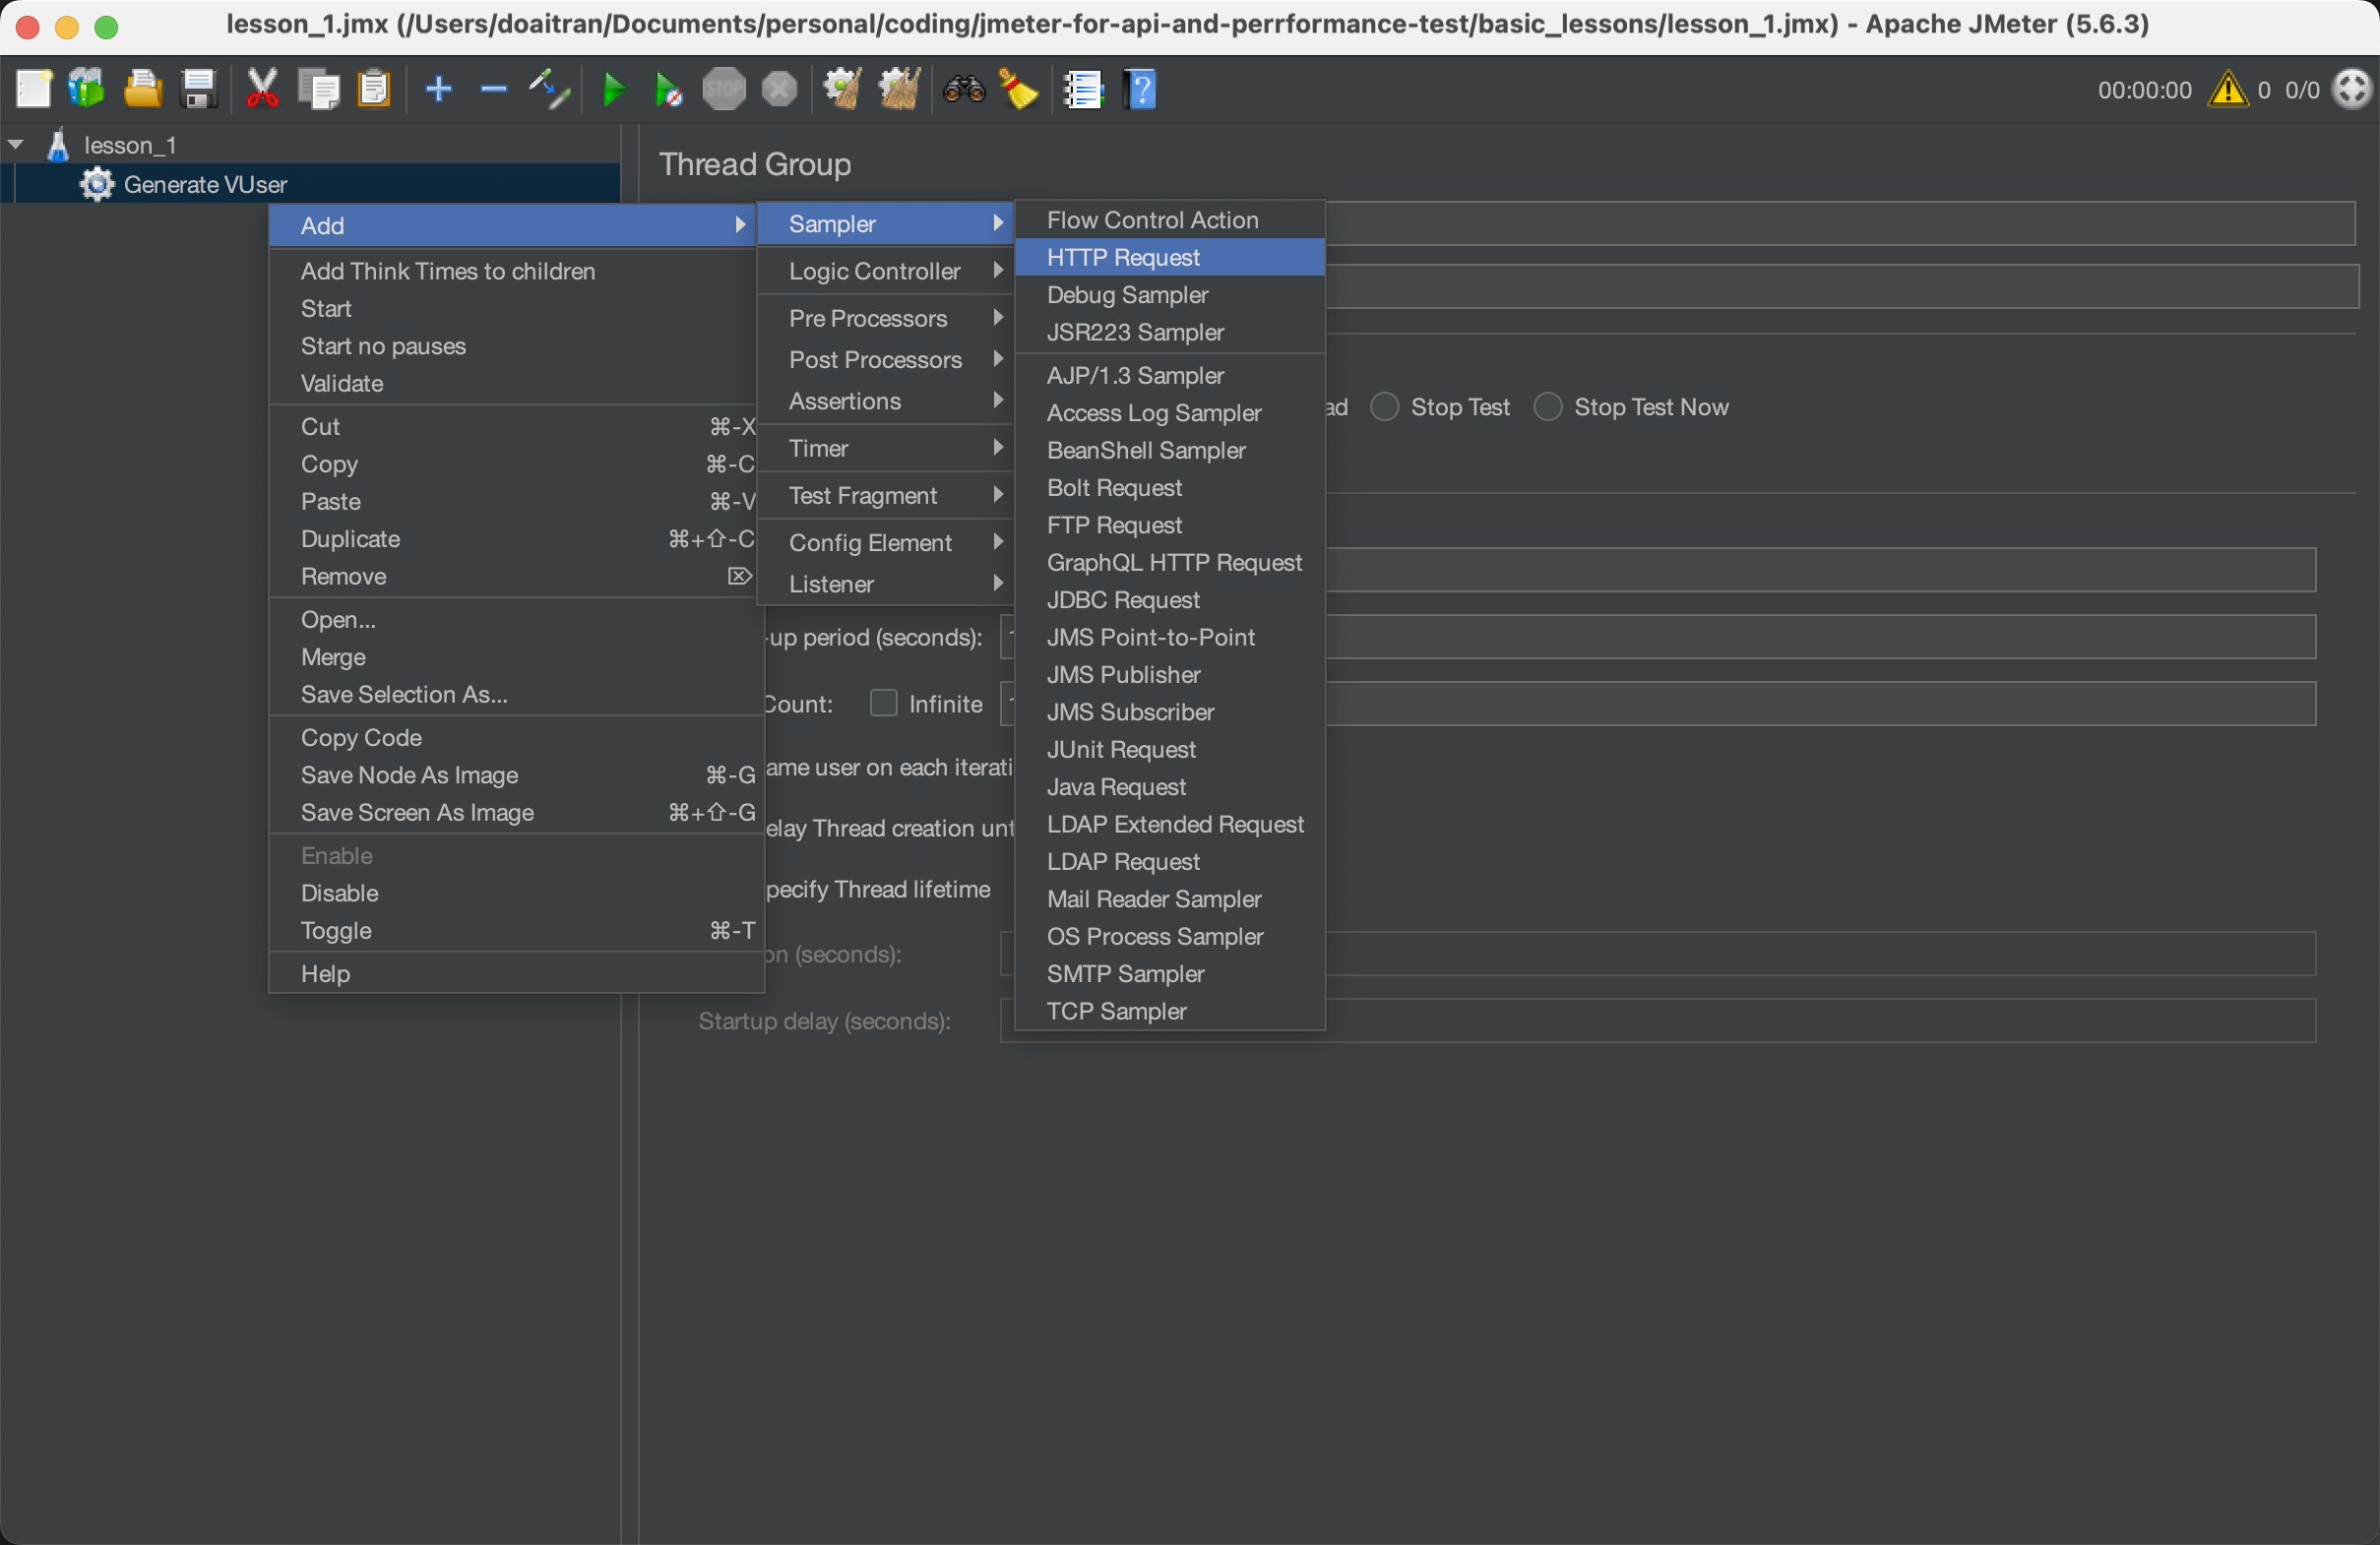
3. Add a simple sampler
We can create a simple sampler by
- Right Click on your Thread Group
- Select Add
- Select Sampler
- Select HTTP Request
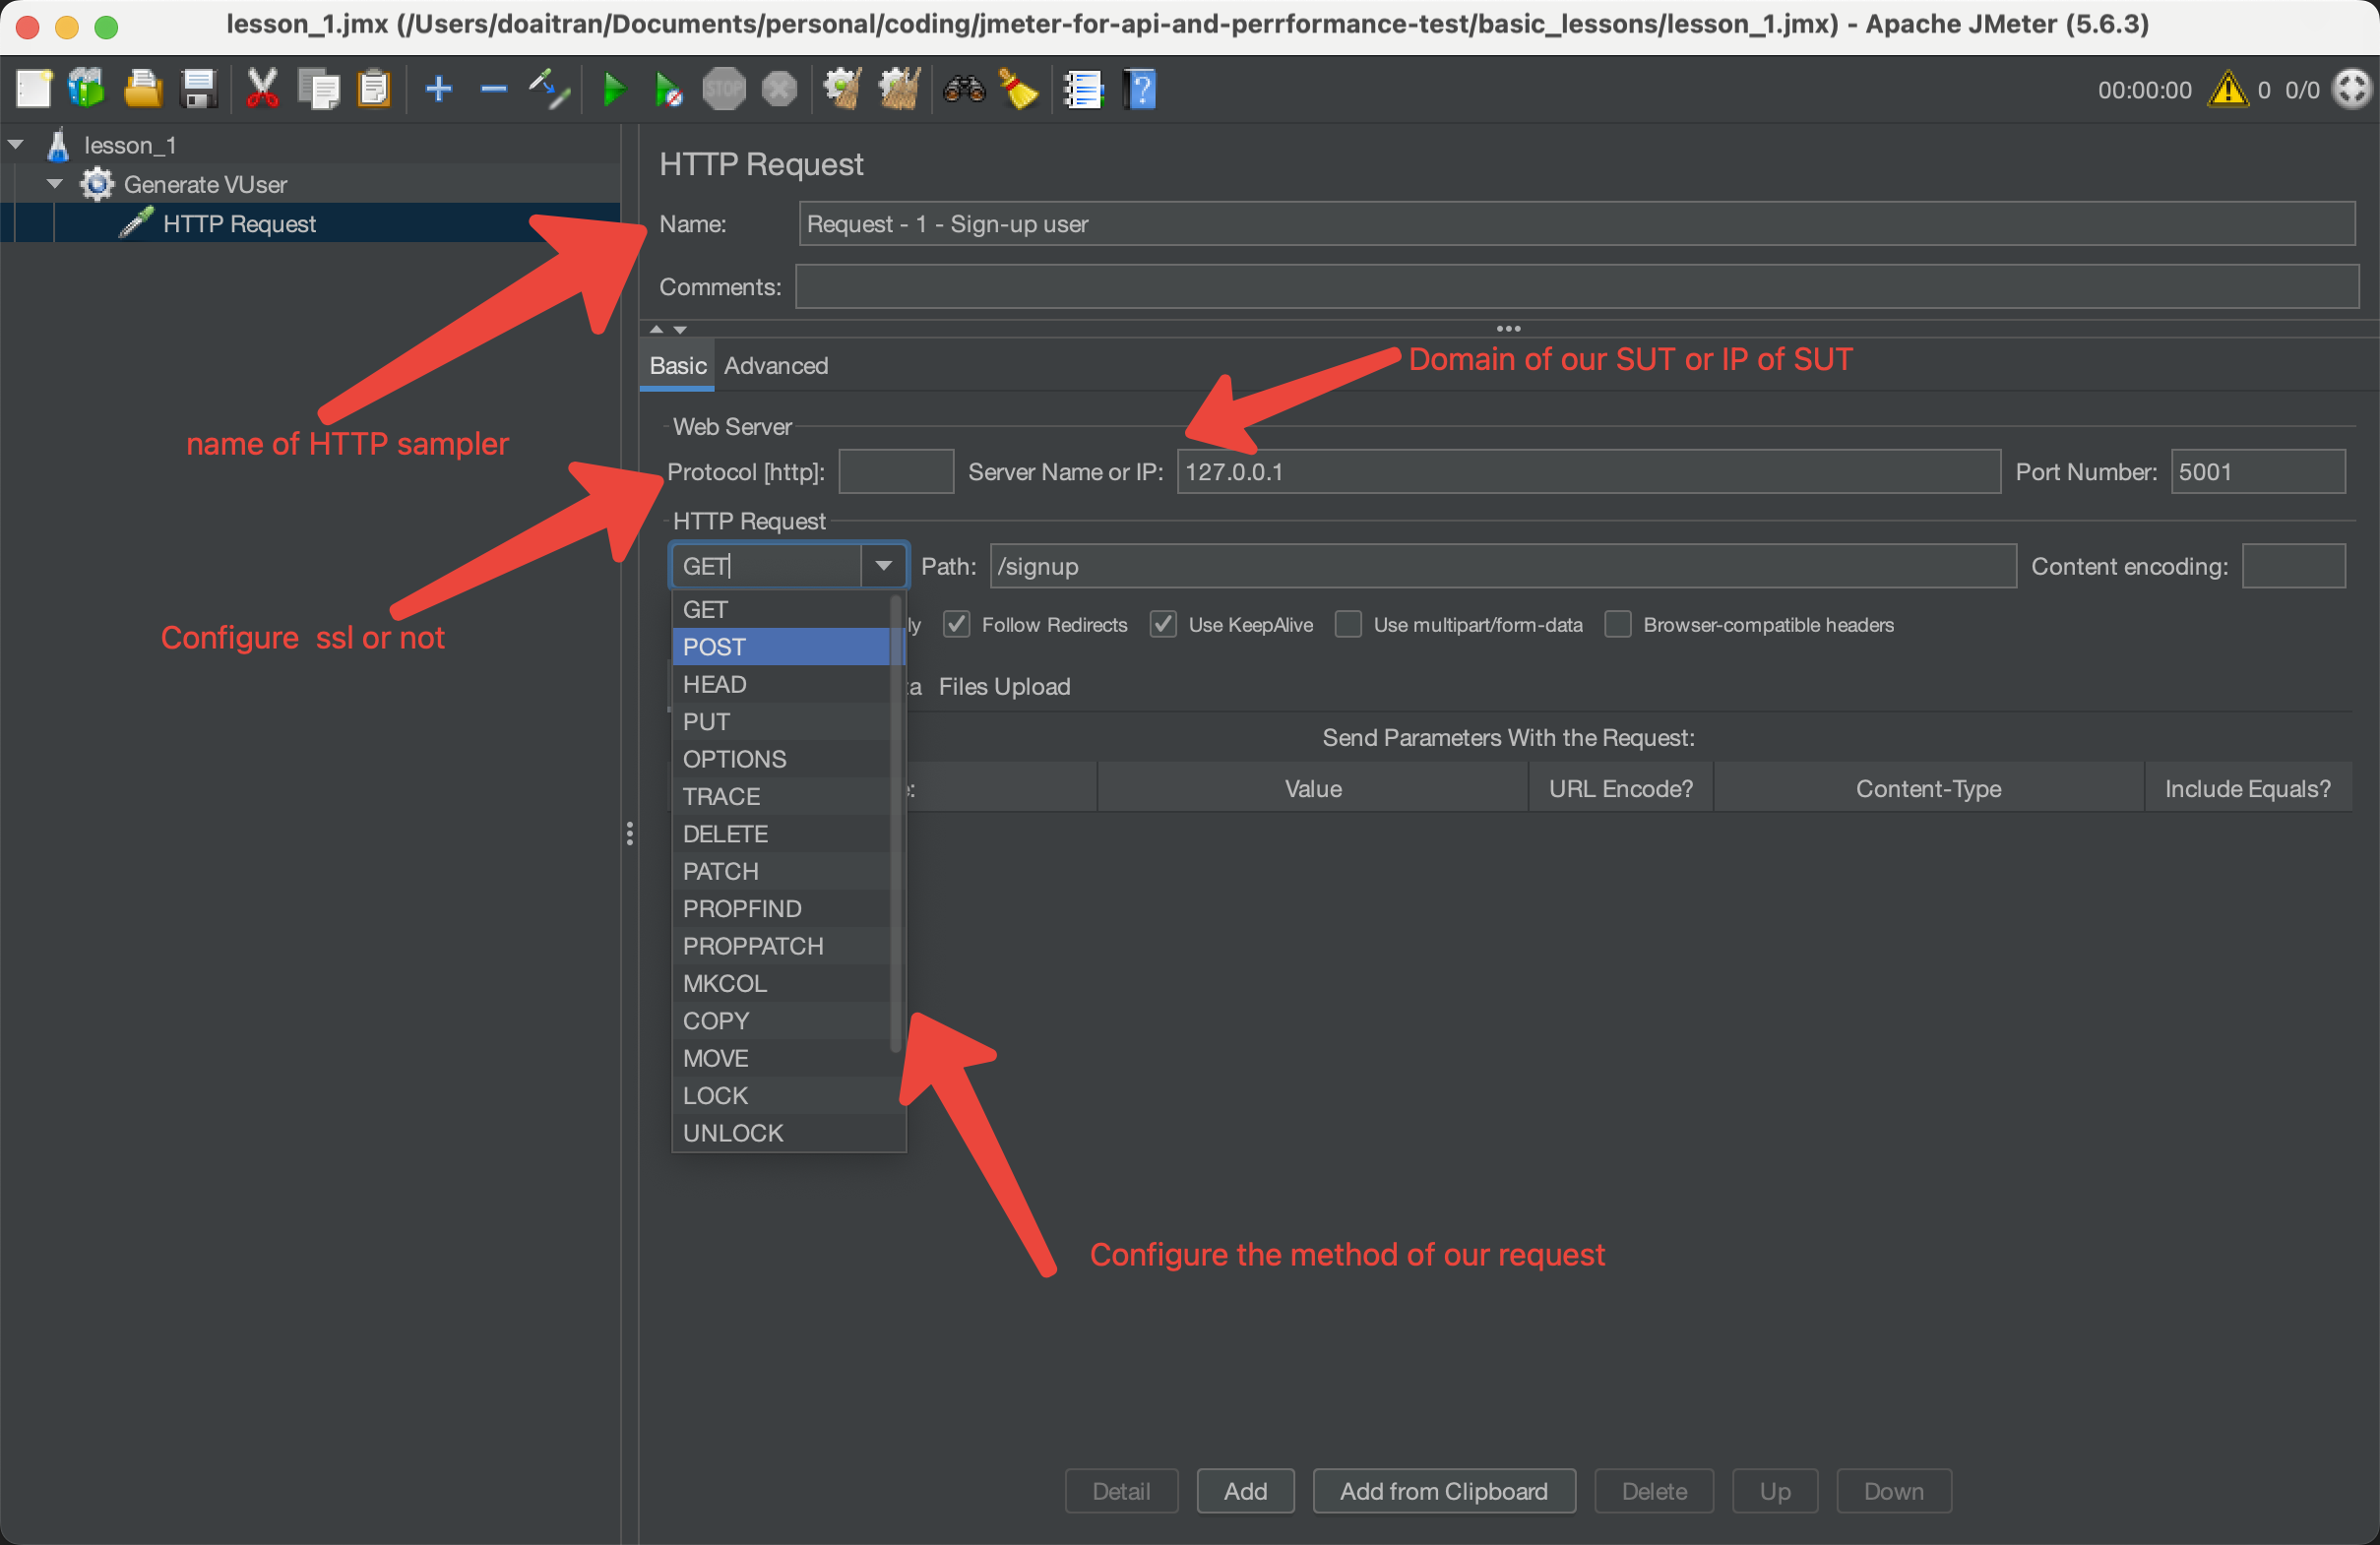
- Take the name of HTTP samplers
We can name our http sampler how it enables us easier to remmember the purpose of samplers
-
Configure the essential information of a request:
- https or http
- Http request method
- Server IP or Domain of SUT
- Port of API
- Path of API
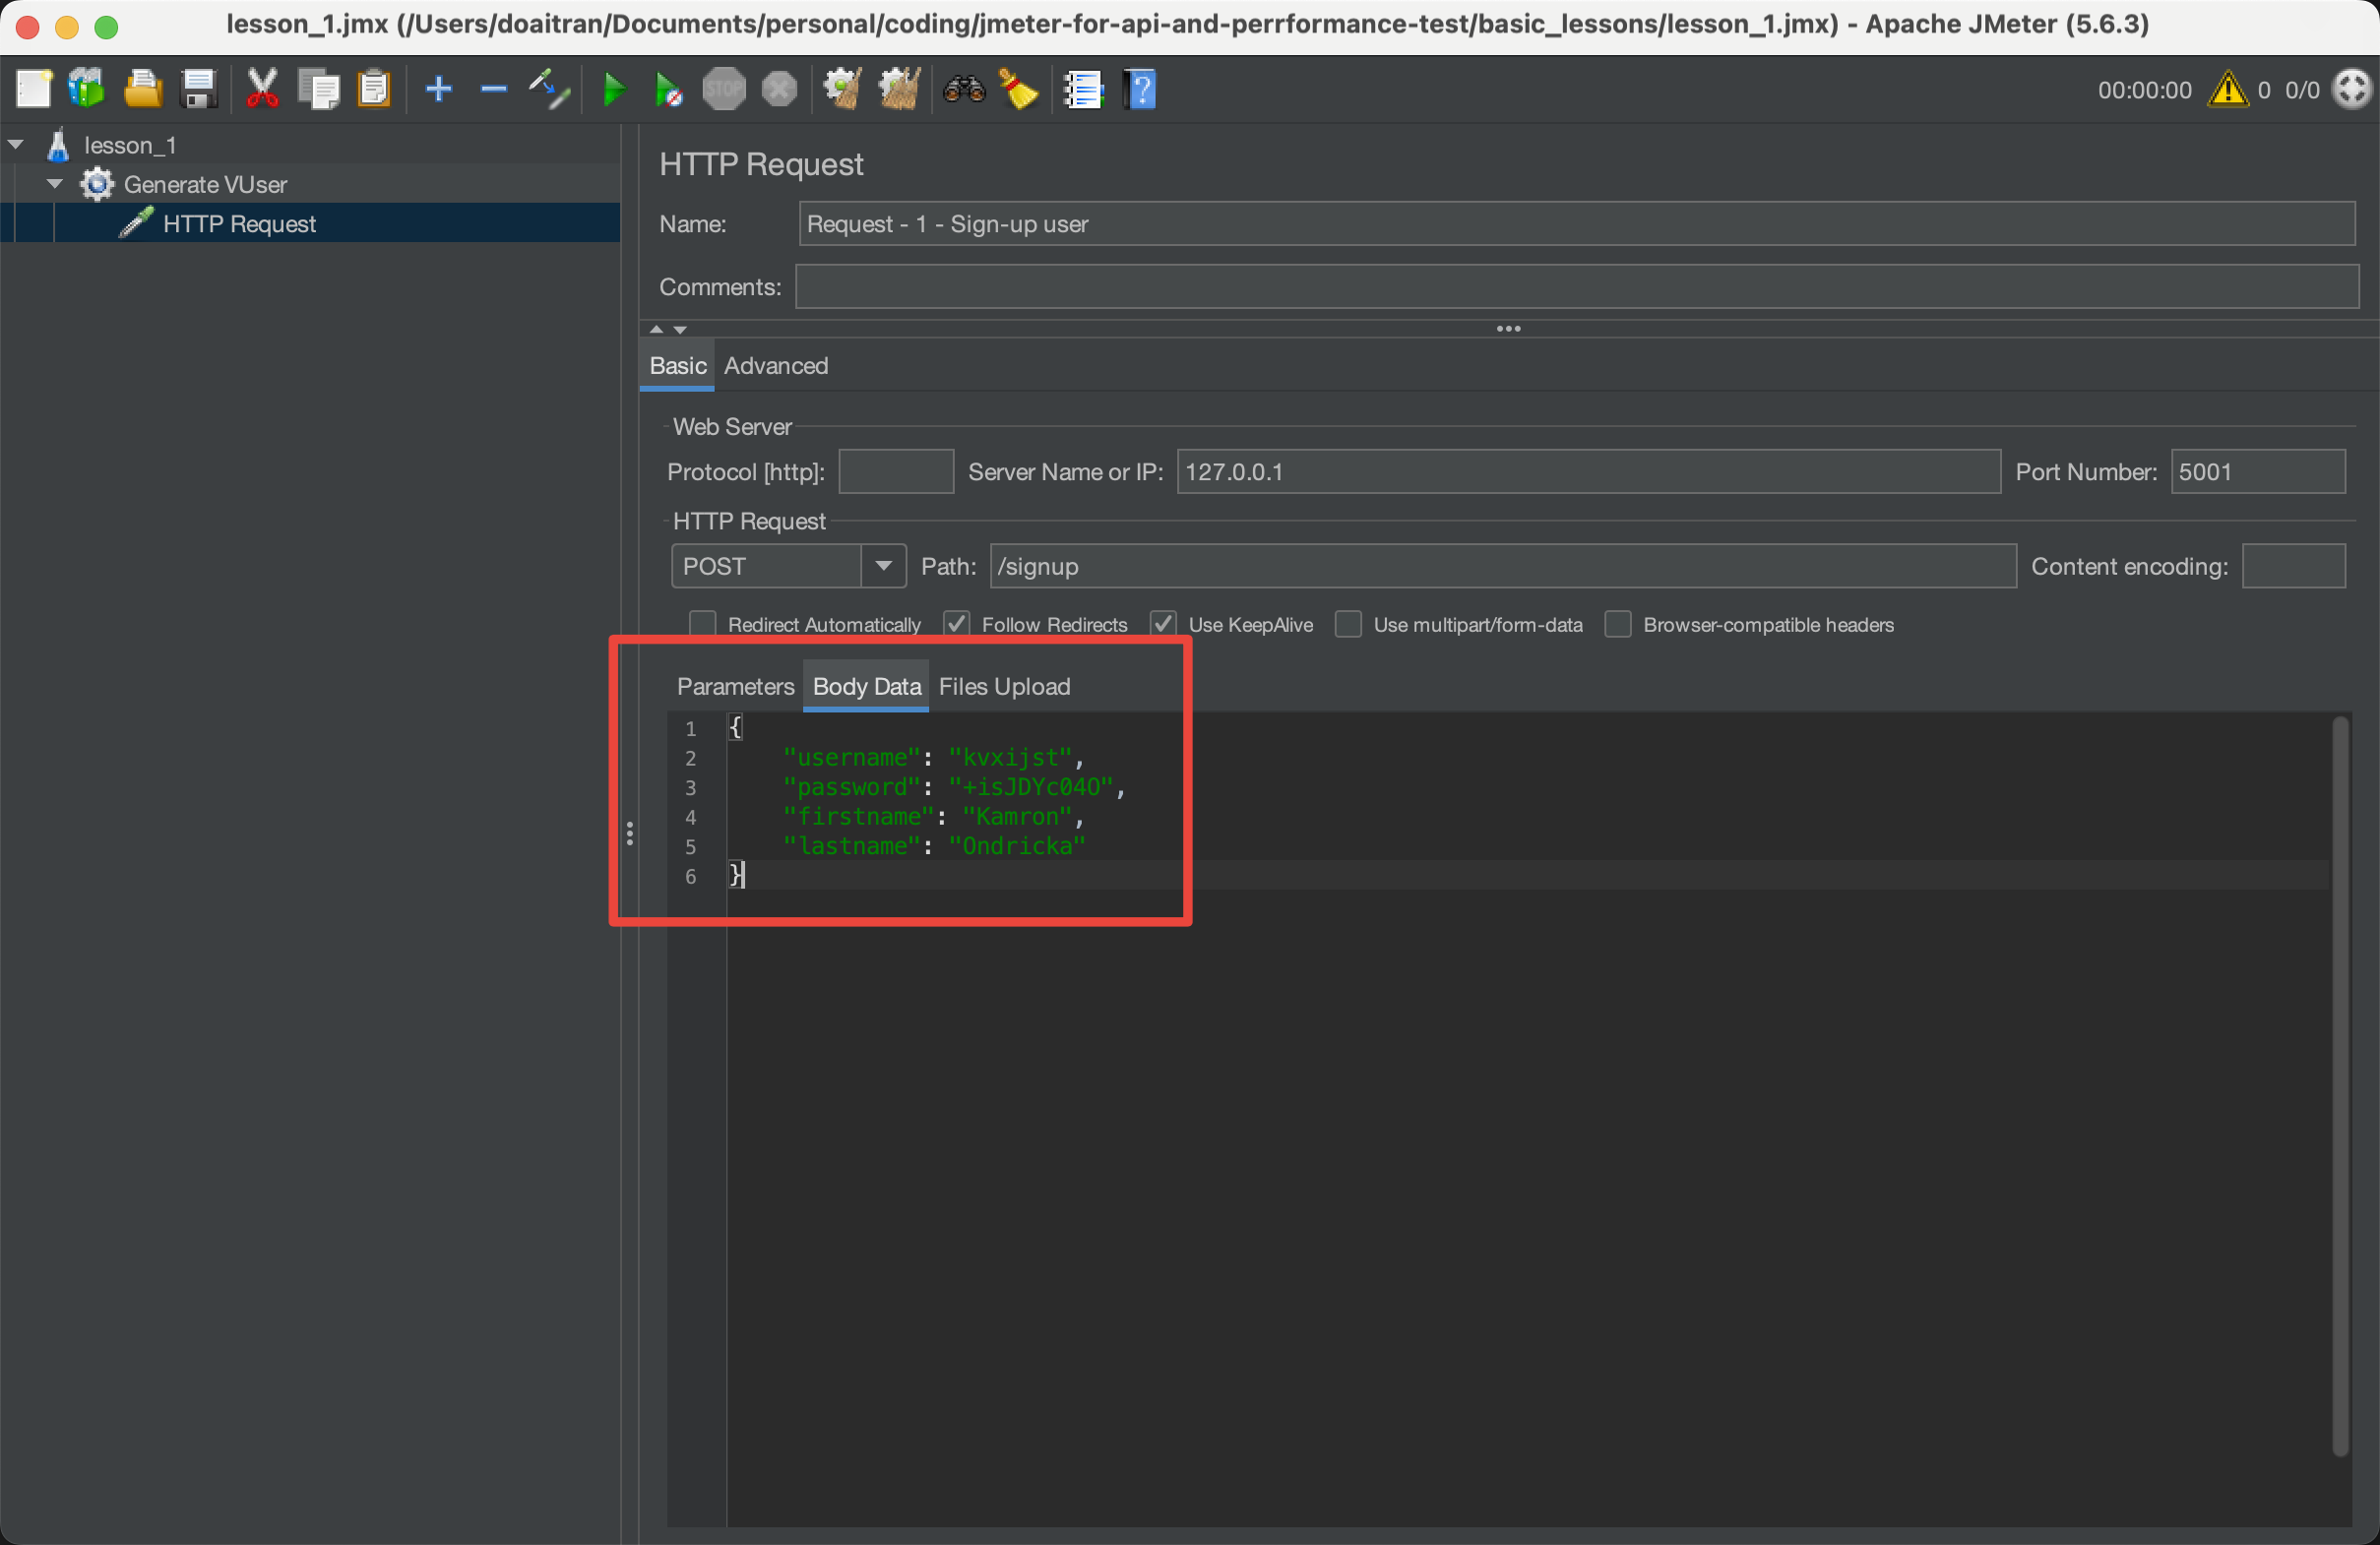
- Body of request. Depending on the types of data
- Params
- Body Data
- File upload
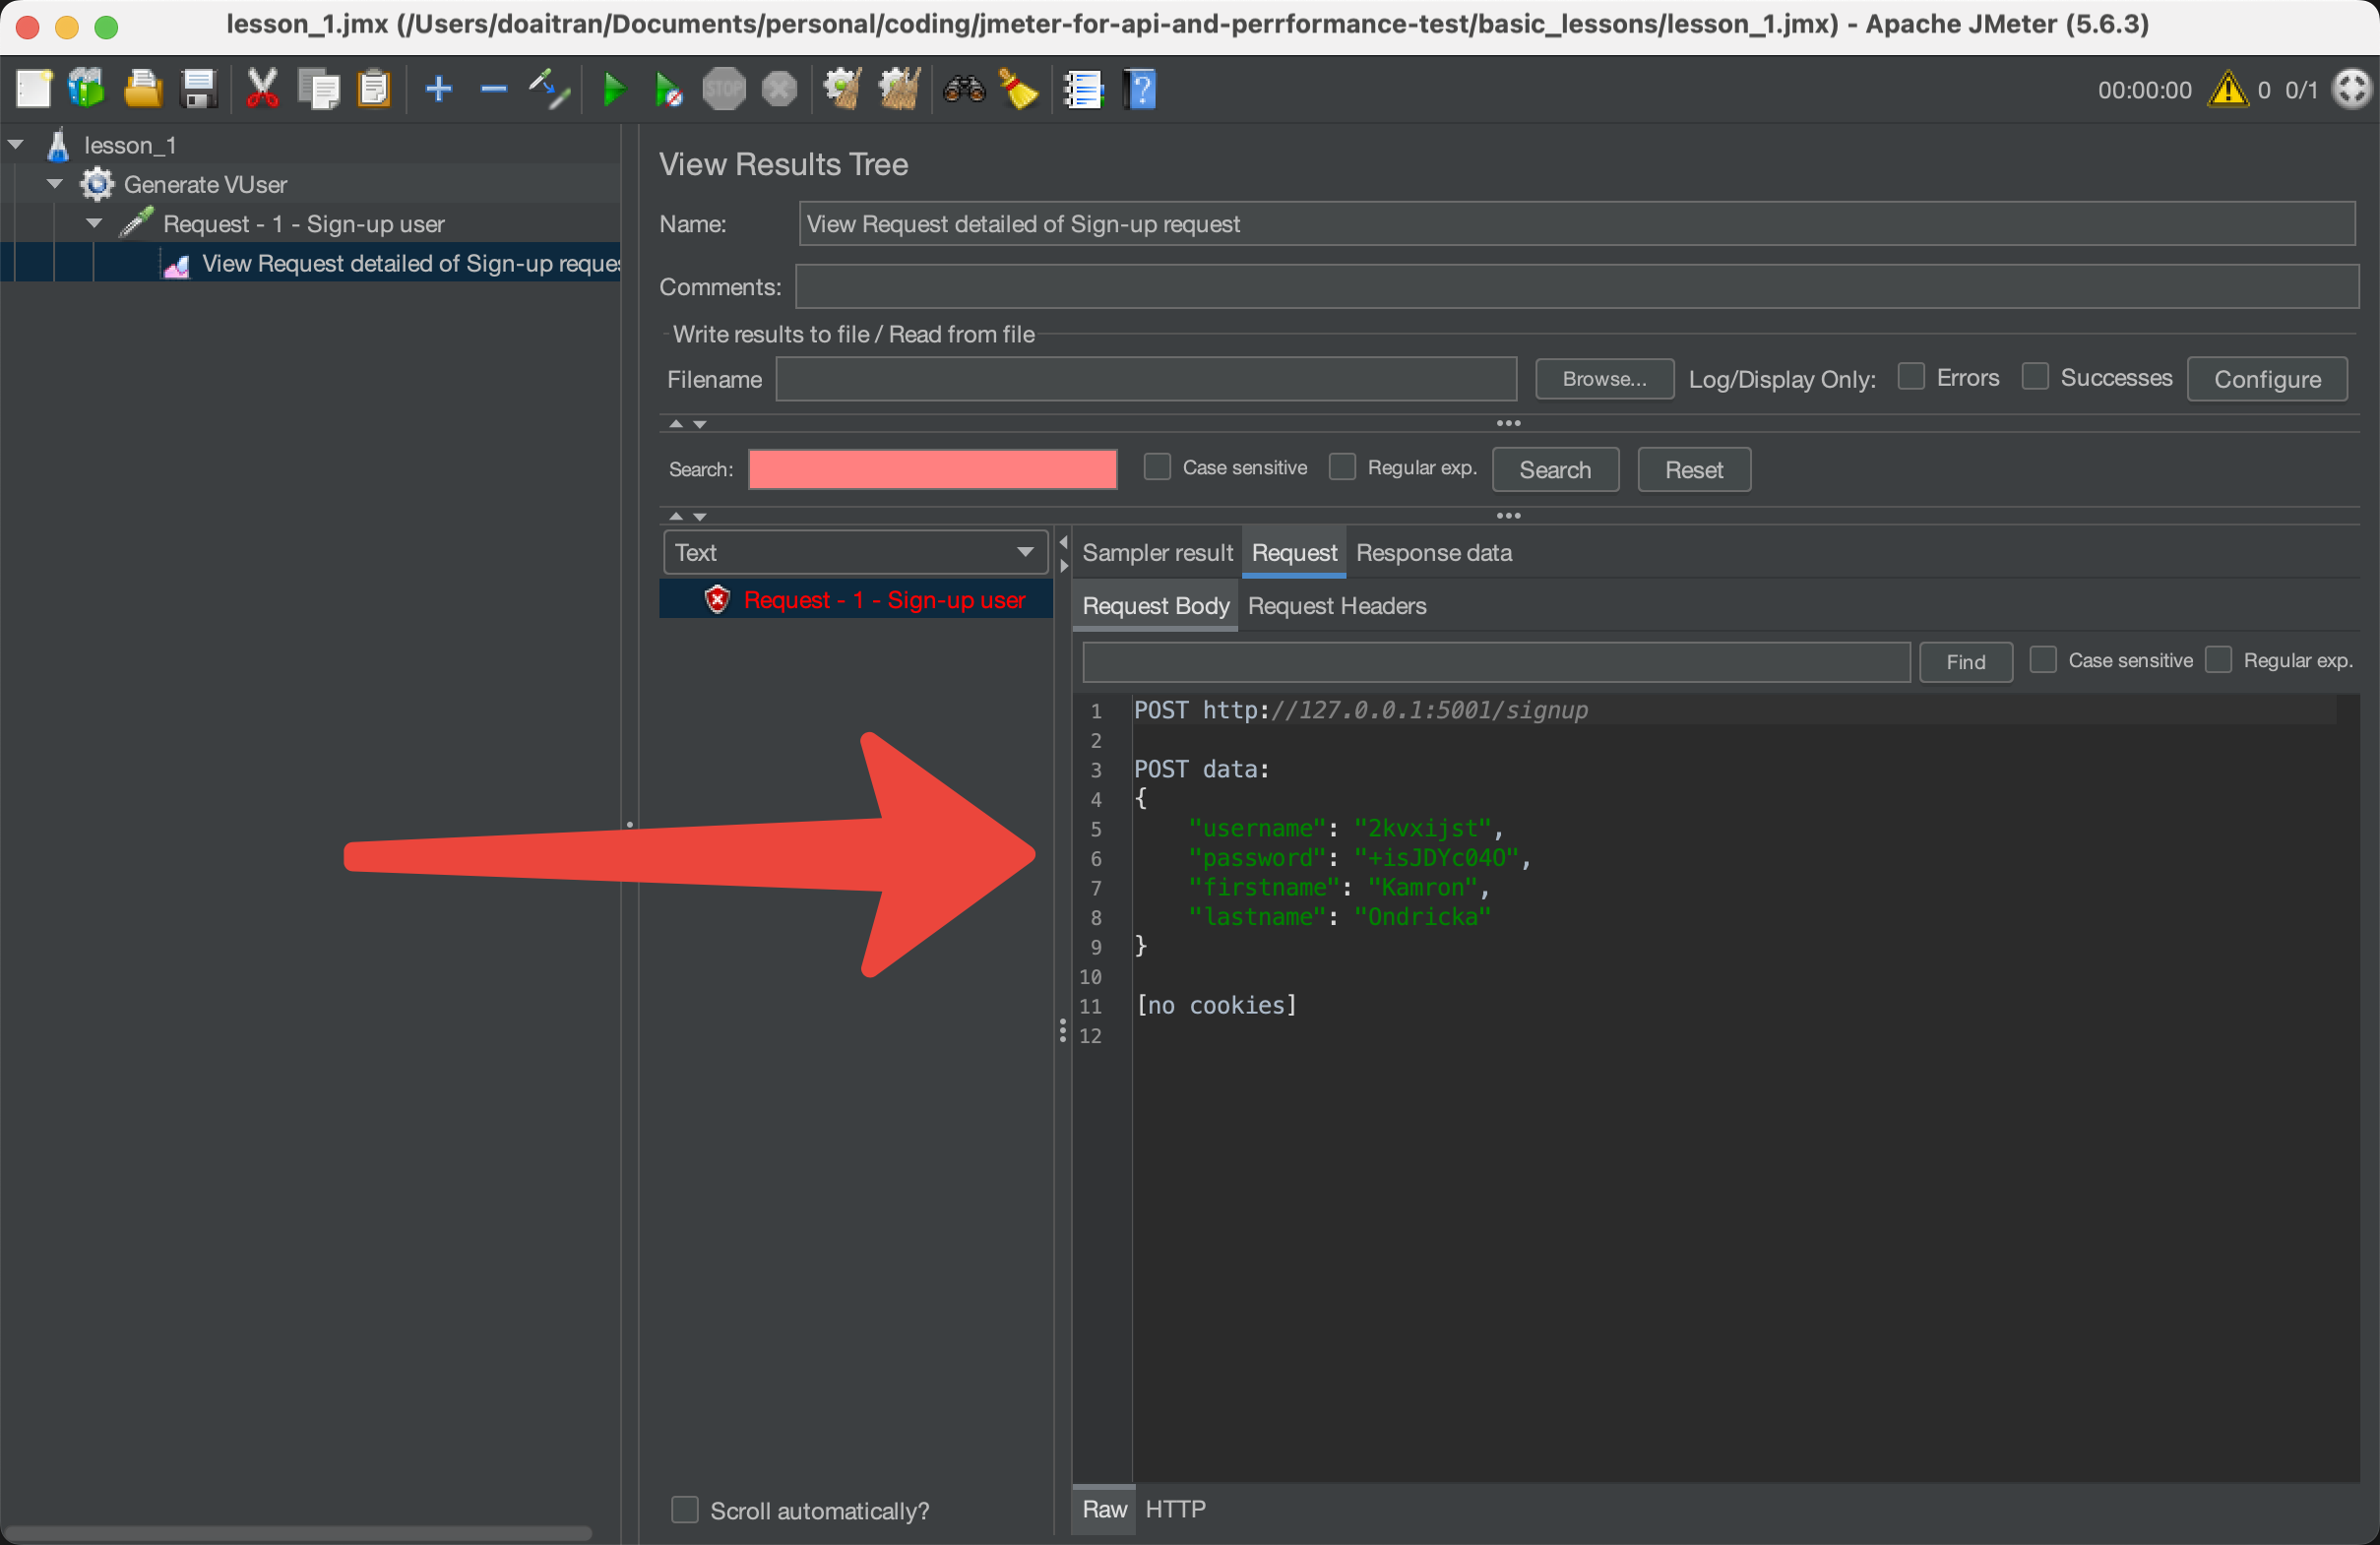
For instance, we configure the body of request as JSON format
{
    "username": "kvxijst",
    "password": "+isJDYc04O",
    "firstname": "Kamron",
    "lastname": "Ondricka"
}
We configure the body request as below:
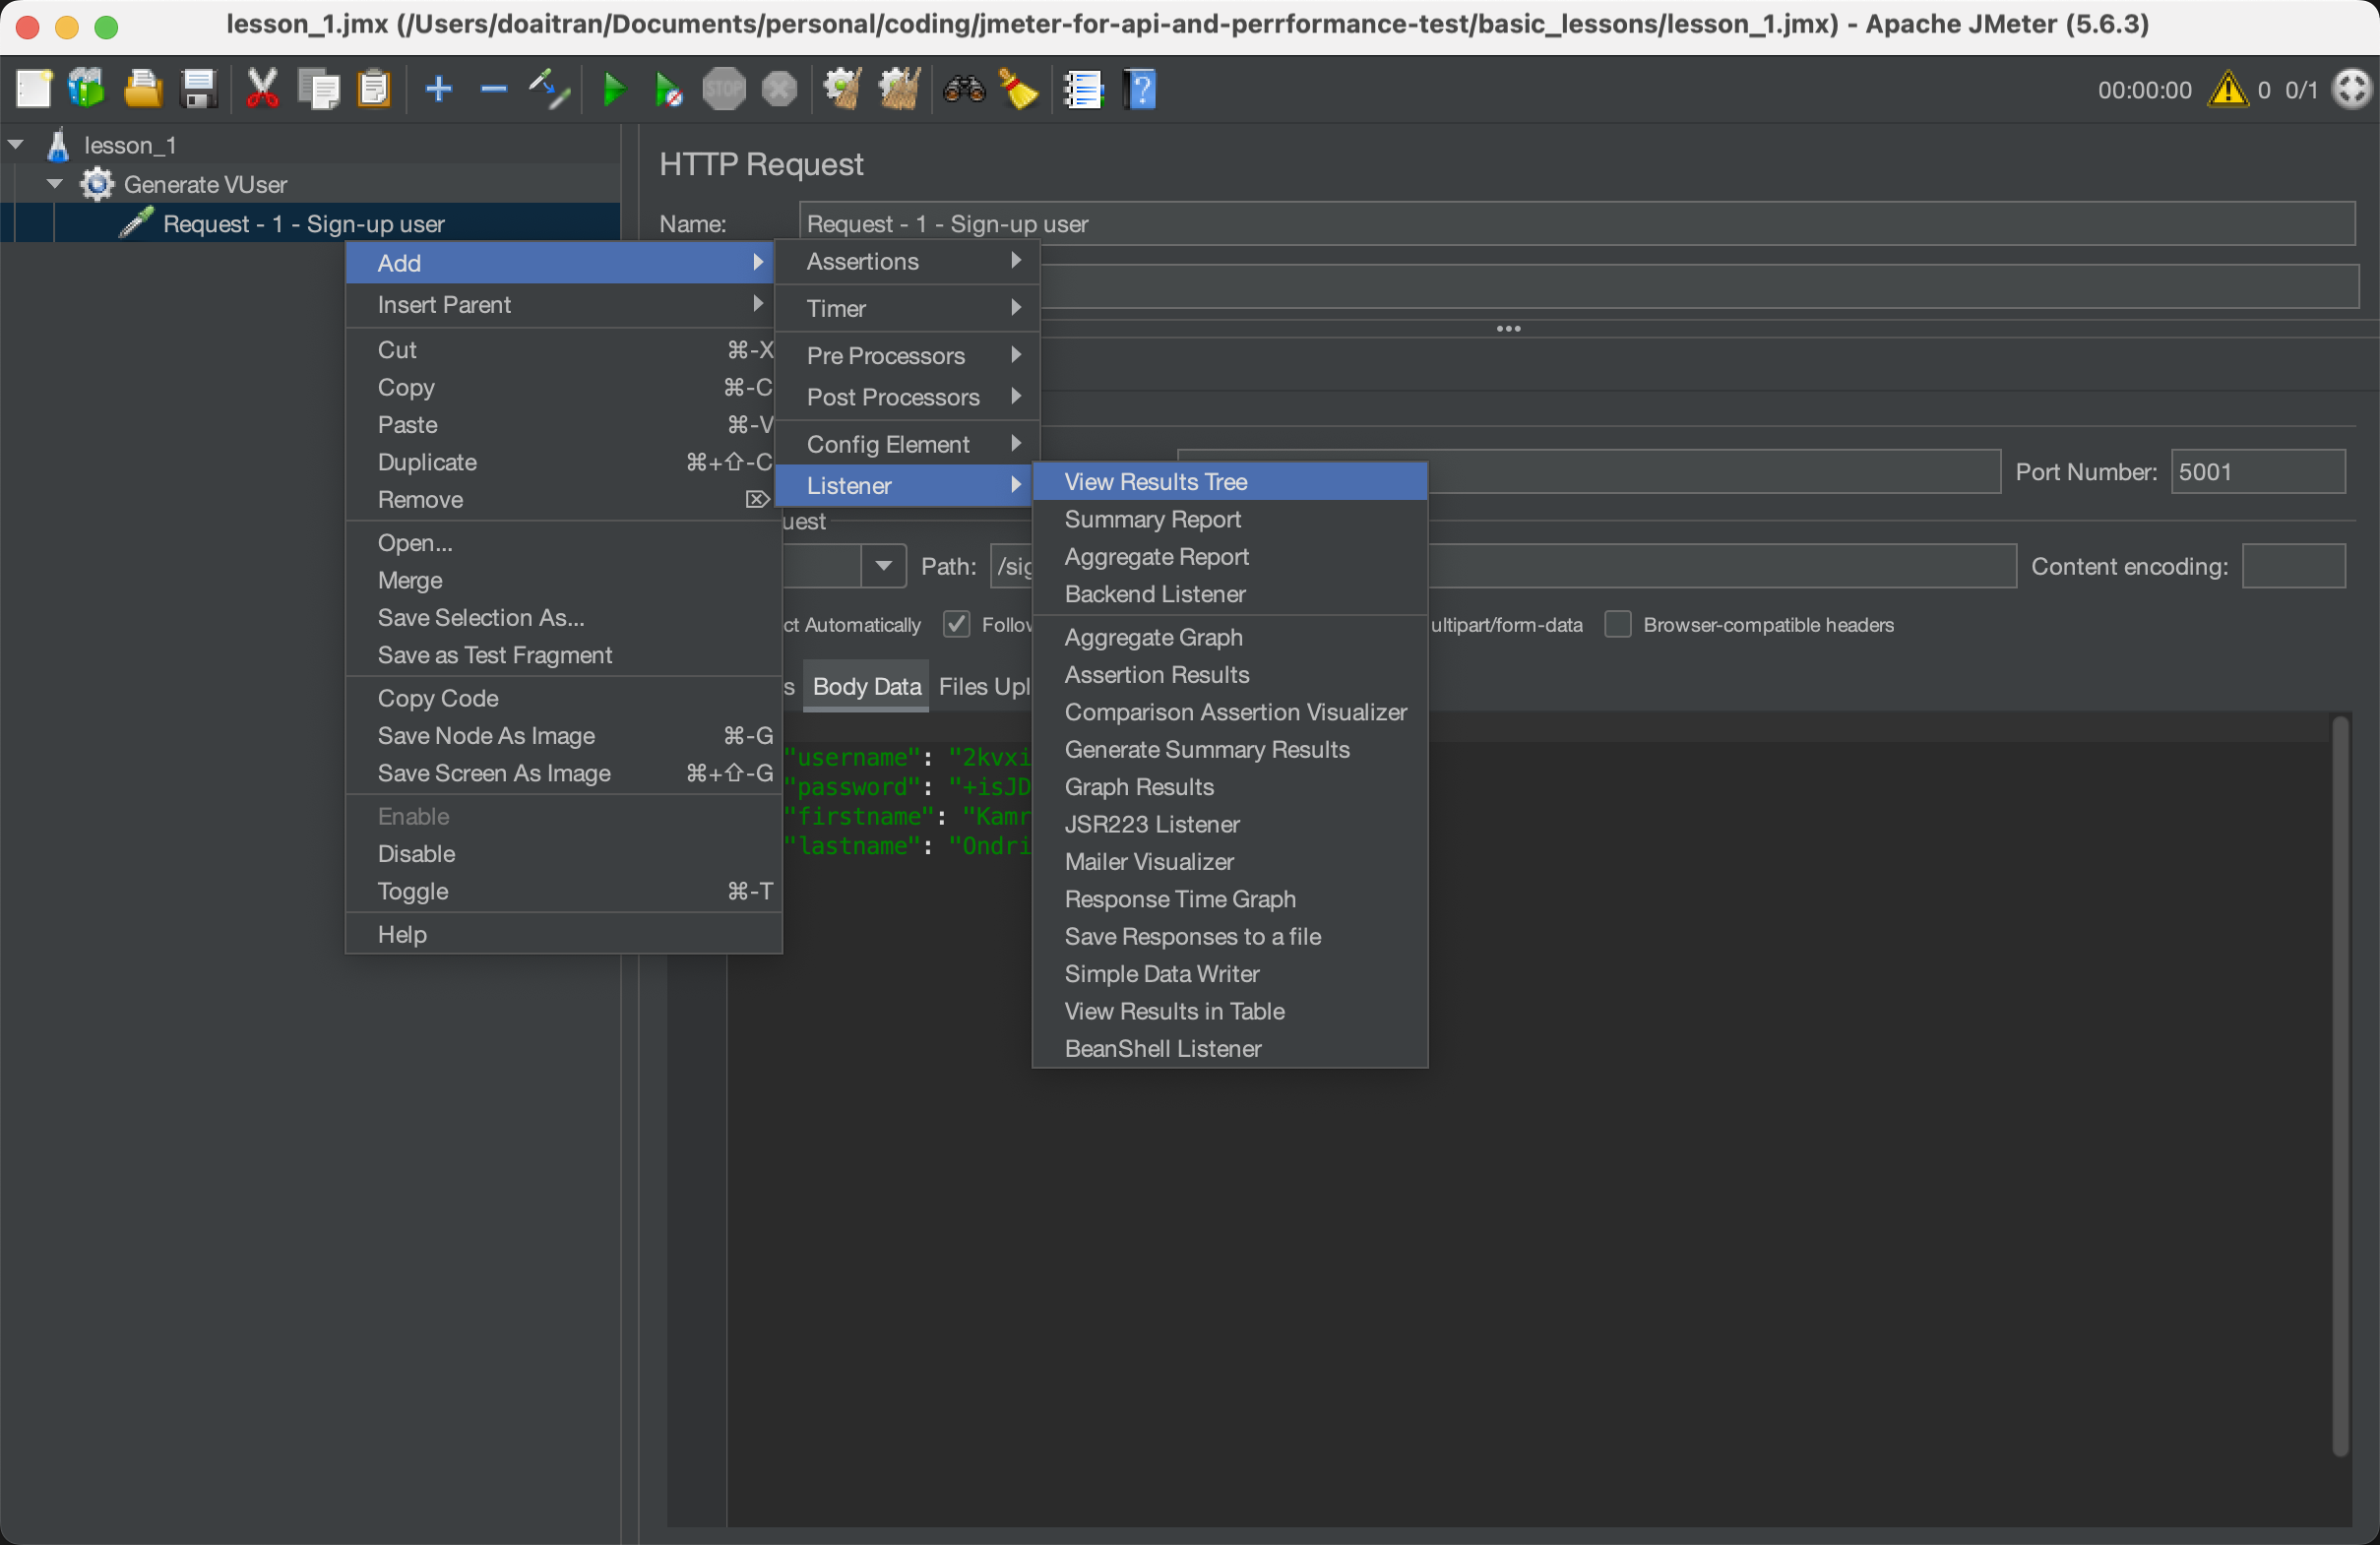
4. Adding a Listener
Before we run the test script, we add a listener which taking the capture function of JMeter to help us debug and trace the request and response information. We follow these steps to add a listener in our test plan:
- Right Click on our request.
- Select Add.
- Select Listener
- Select View Results Tree
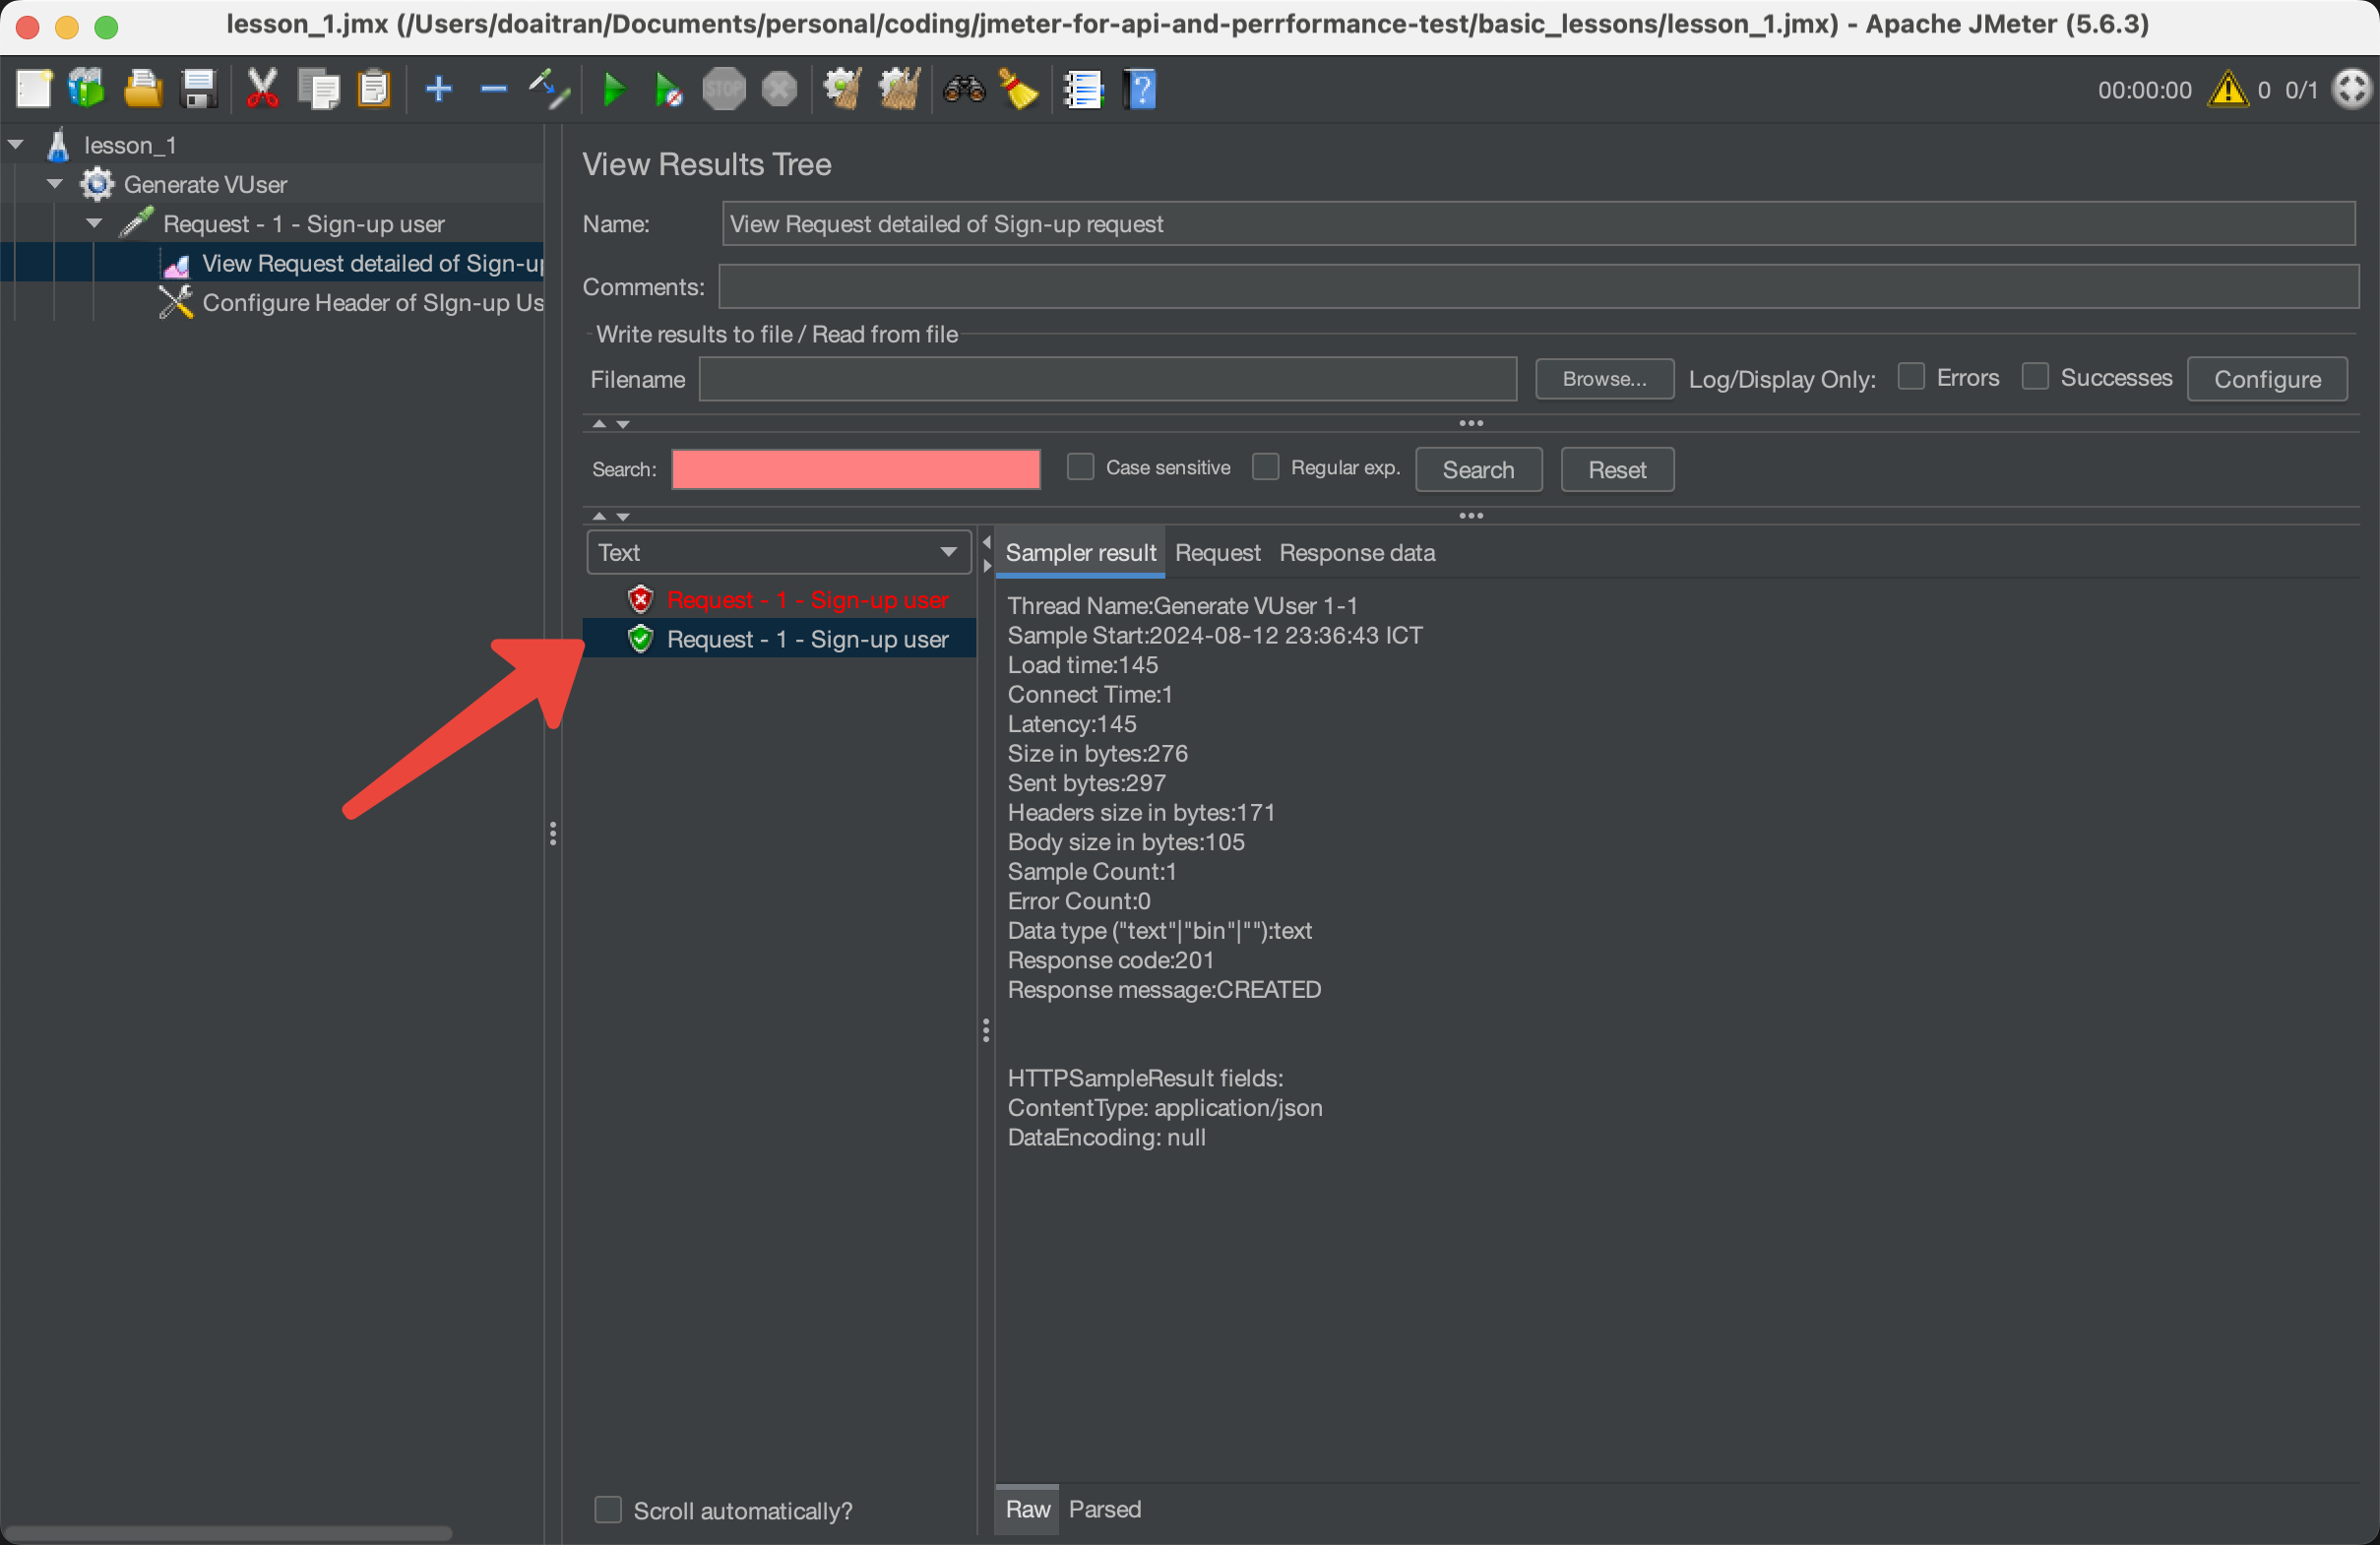
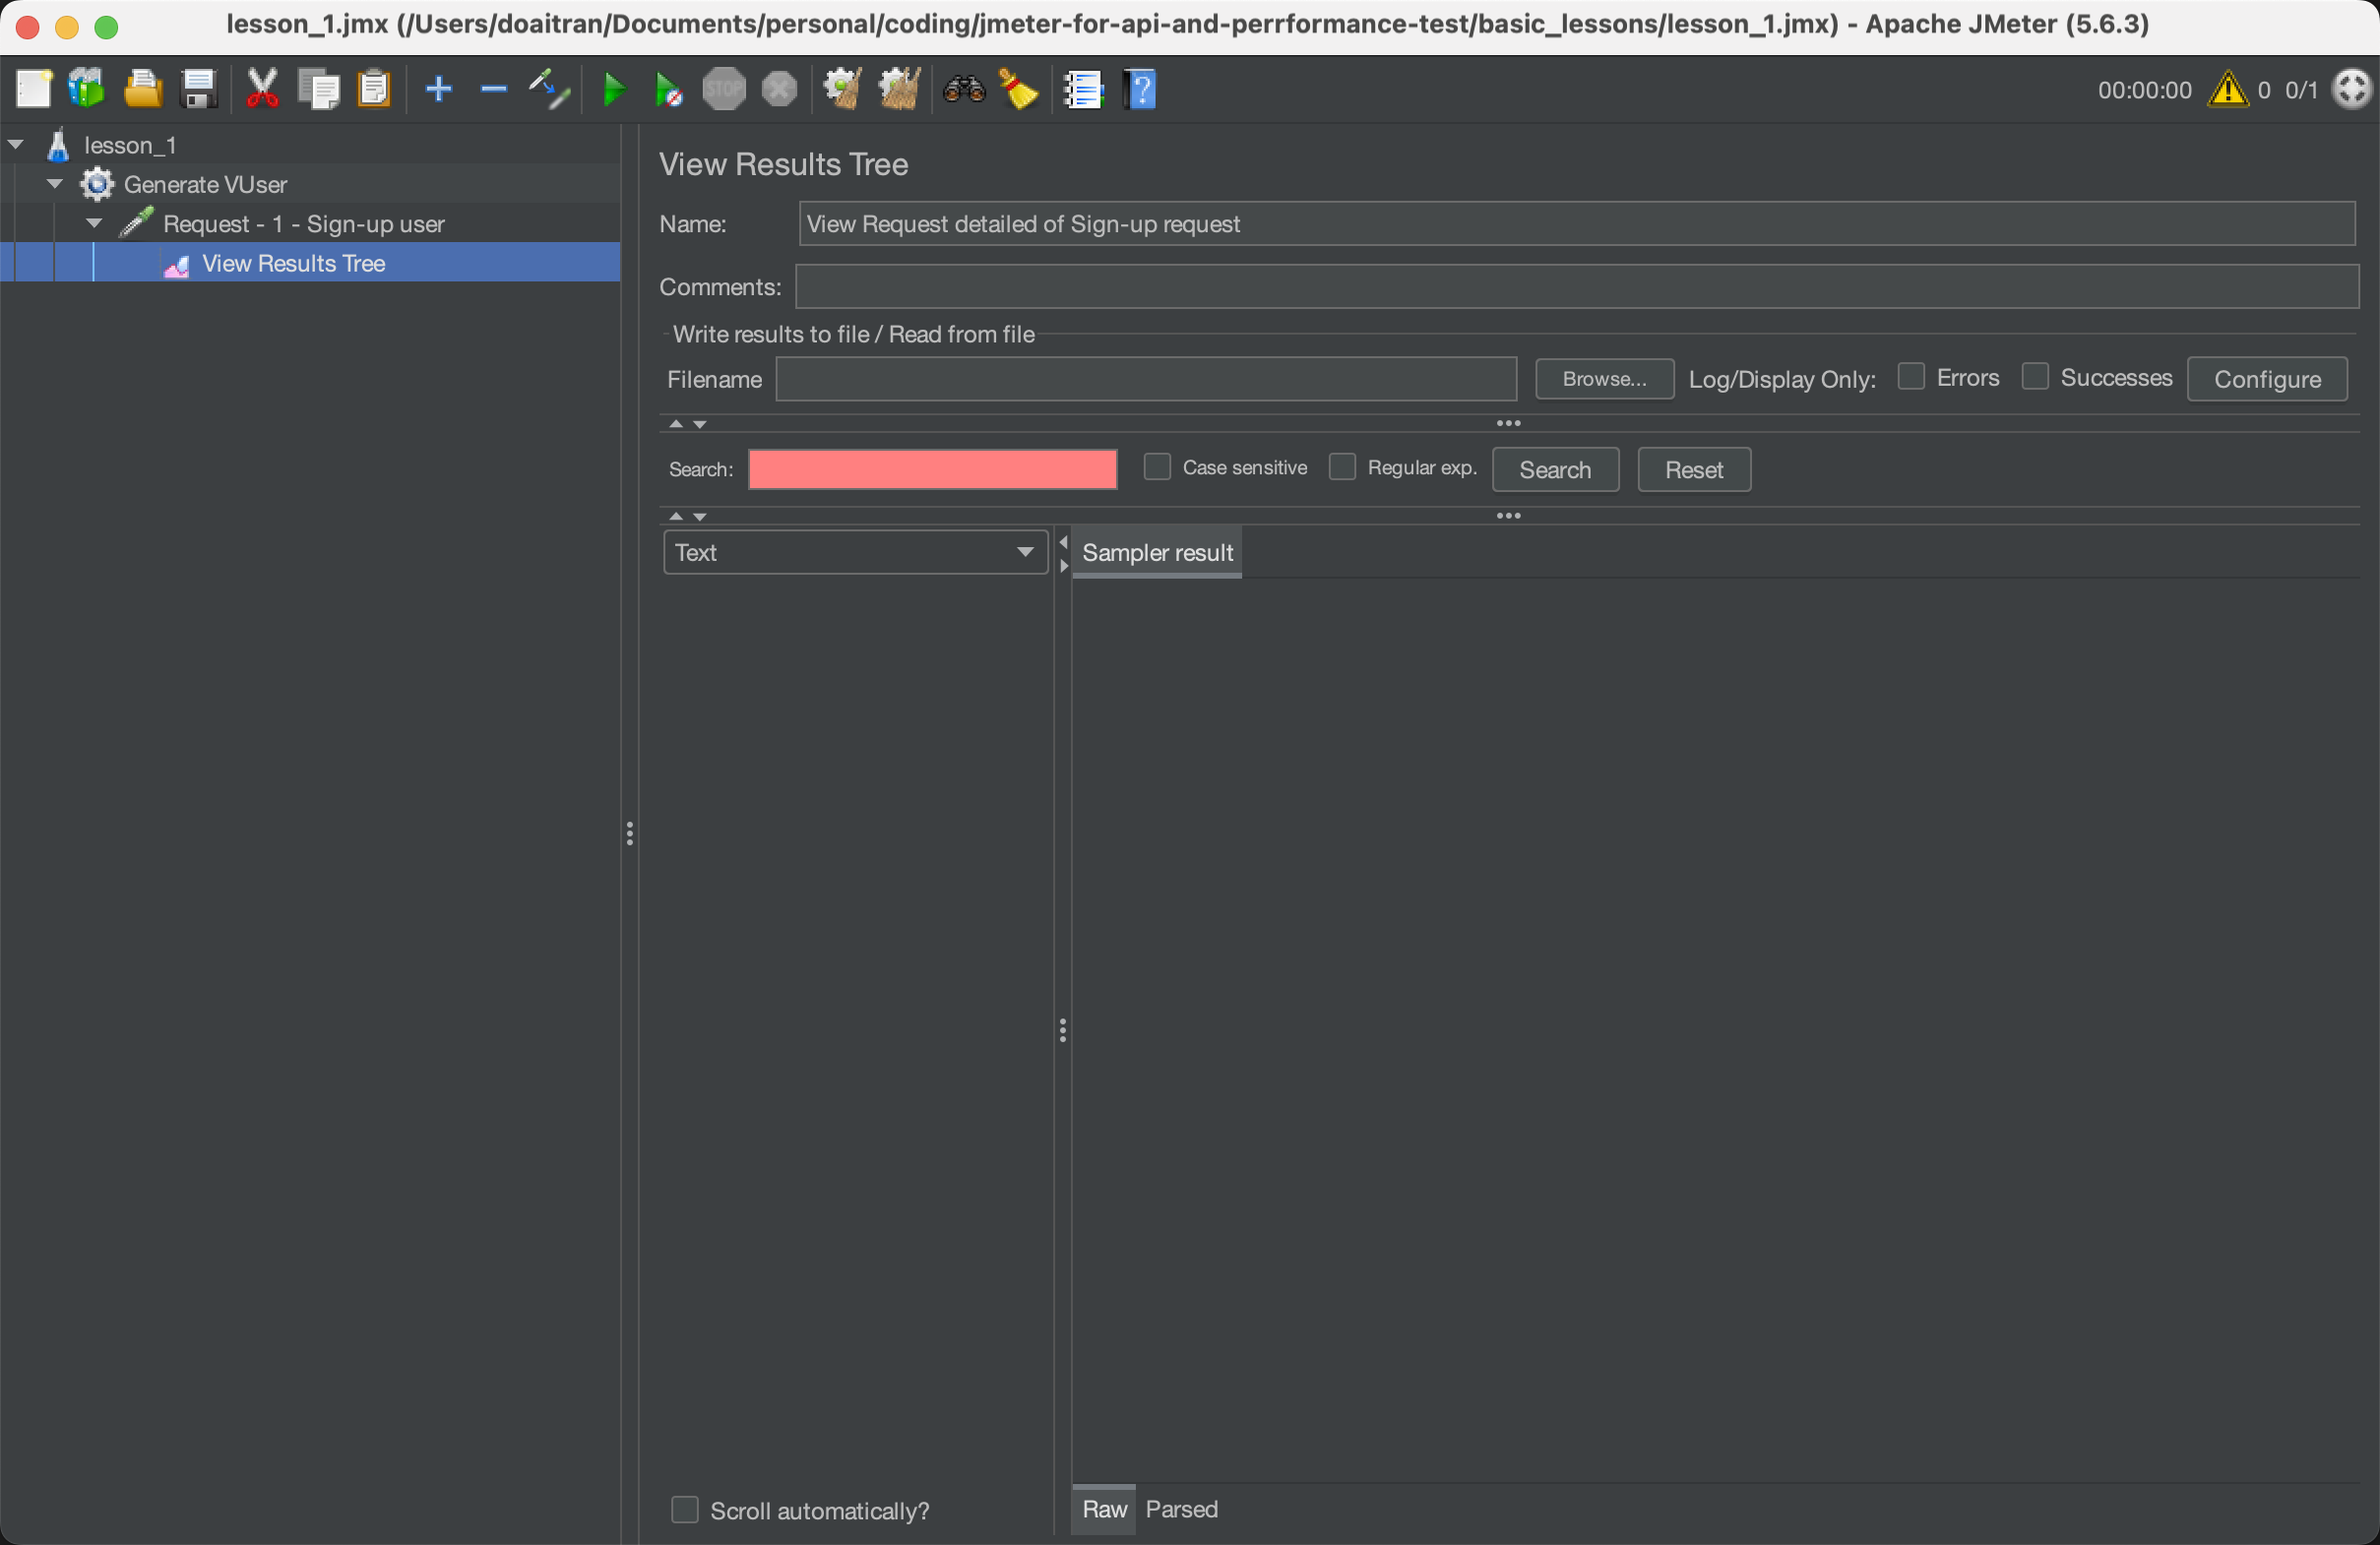
We have the Test Result tree under HTTP sample as below:
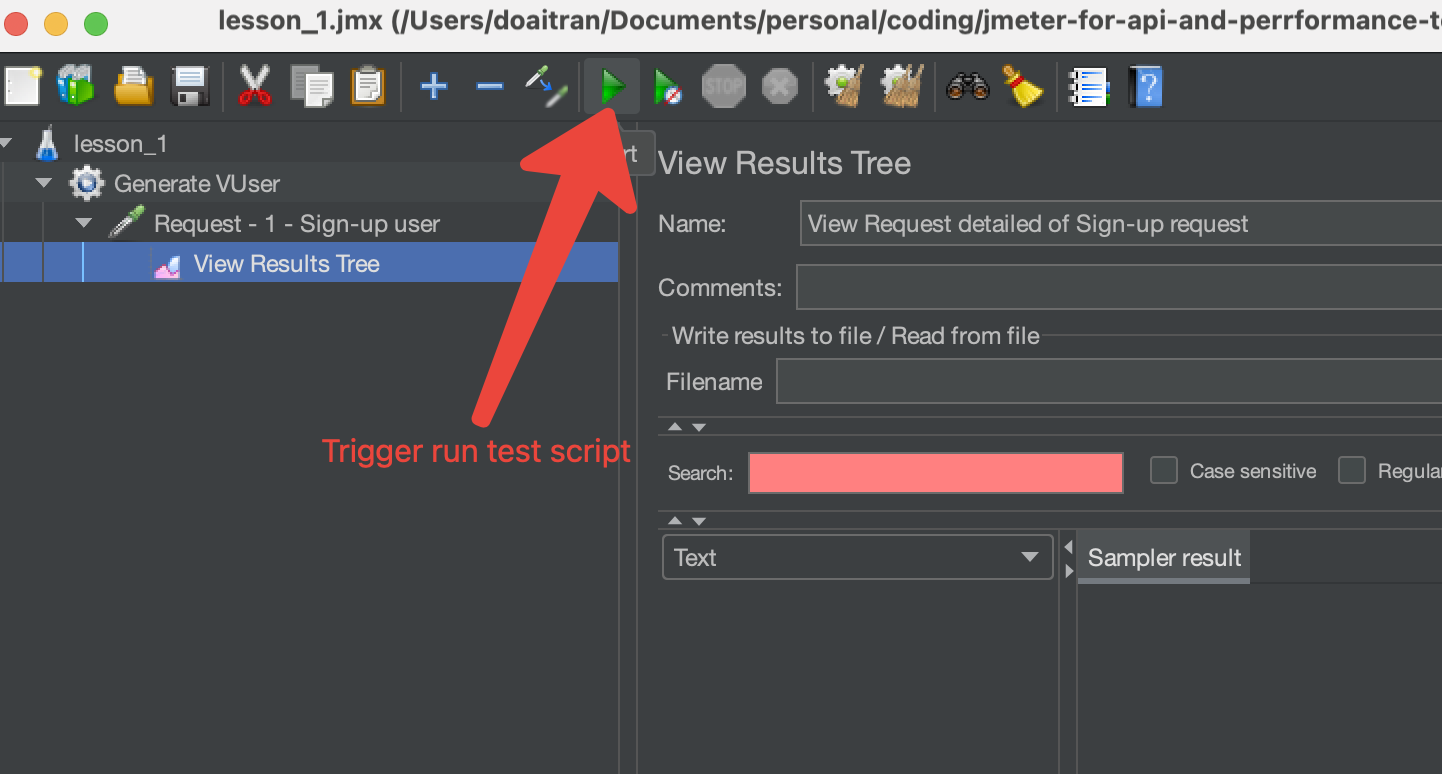
4. Run the JMeter test script
- From JMeter GUI, we can run our JMeter script by clock on Run button
- Follow the response on View Test Result listener.
The result of the example request:
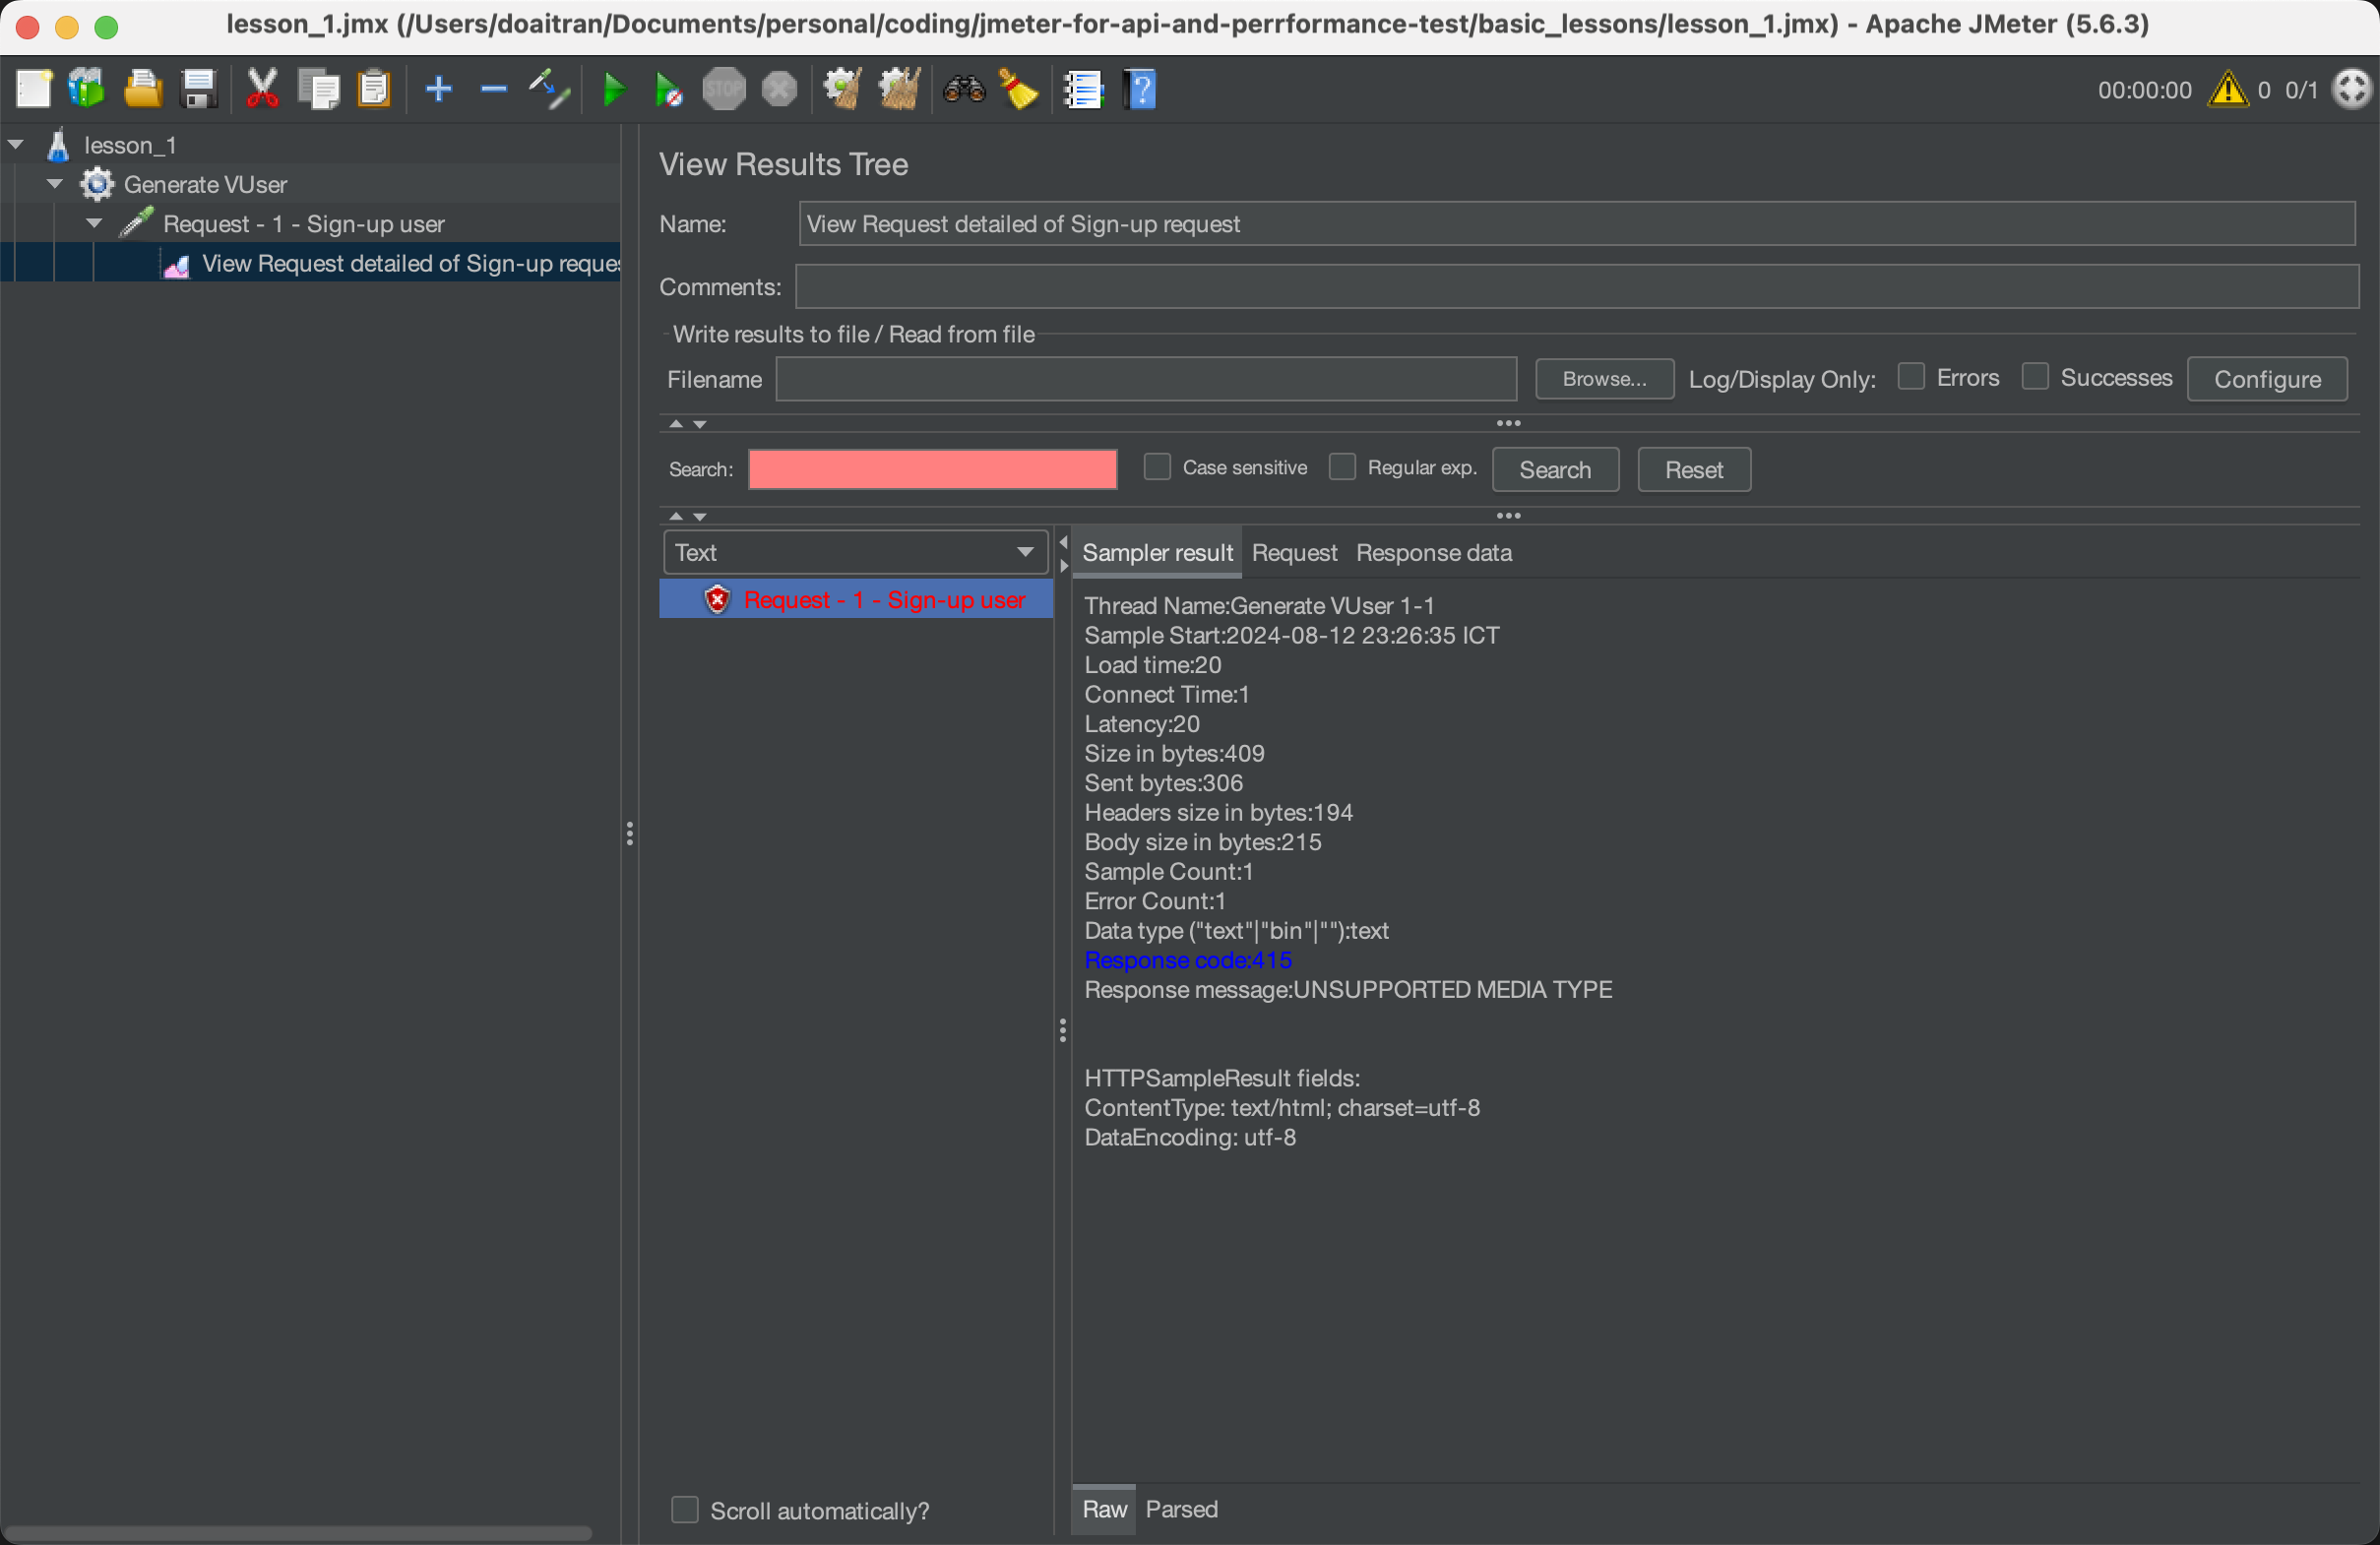
We got the iueee: The response of HTTP request, and We can base on the detailed of Result to detect the issue.
Request
Response
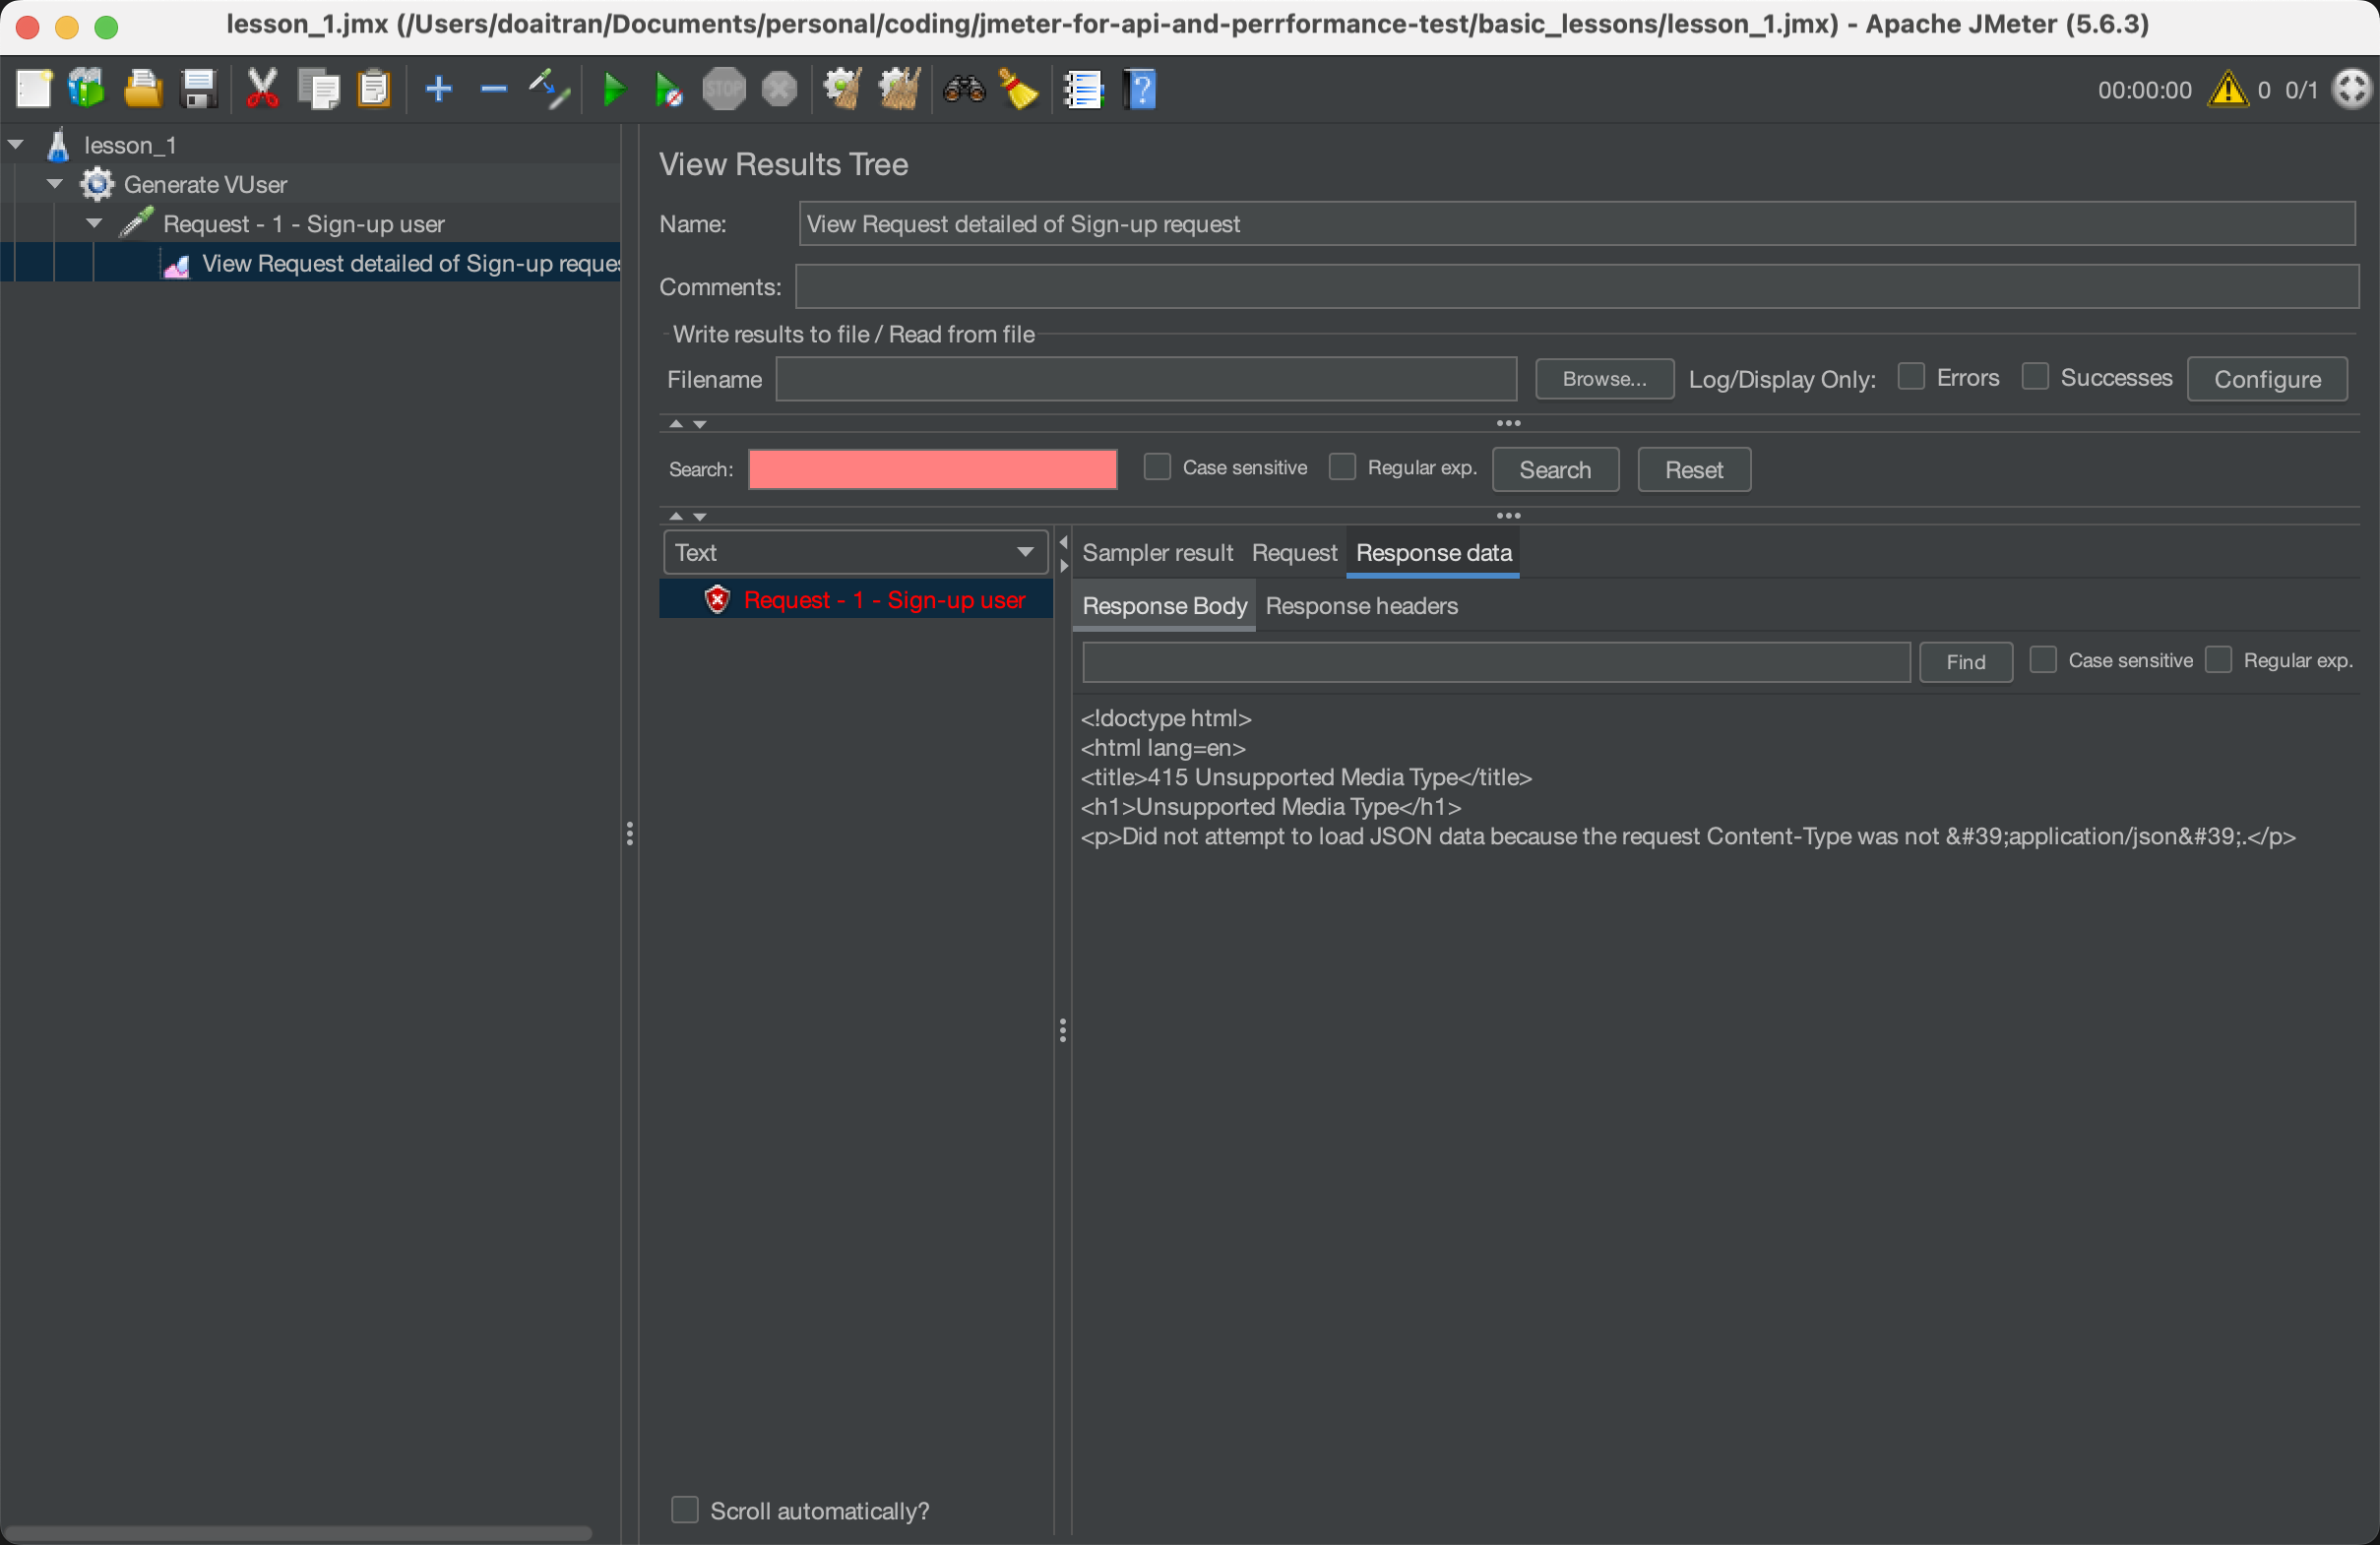
Due to missing the content-type in our HTTP request, the request was failed.
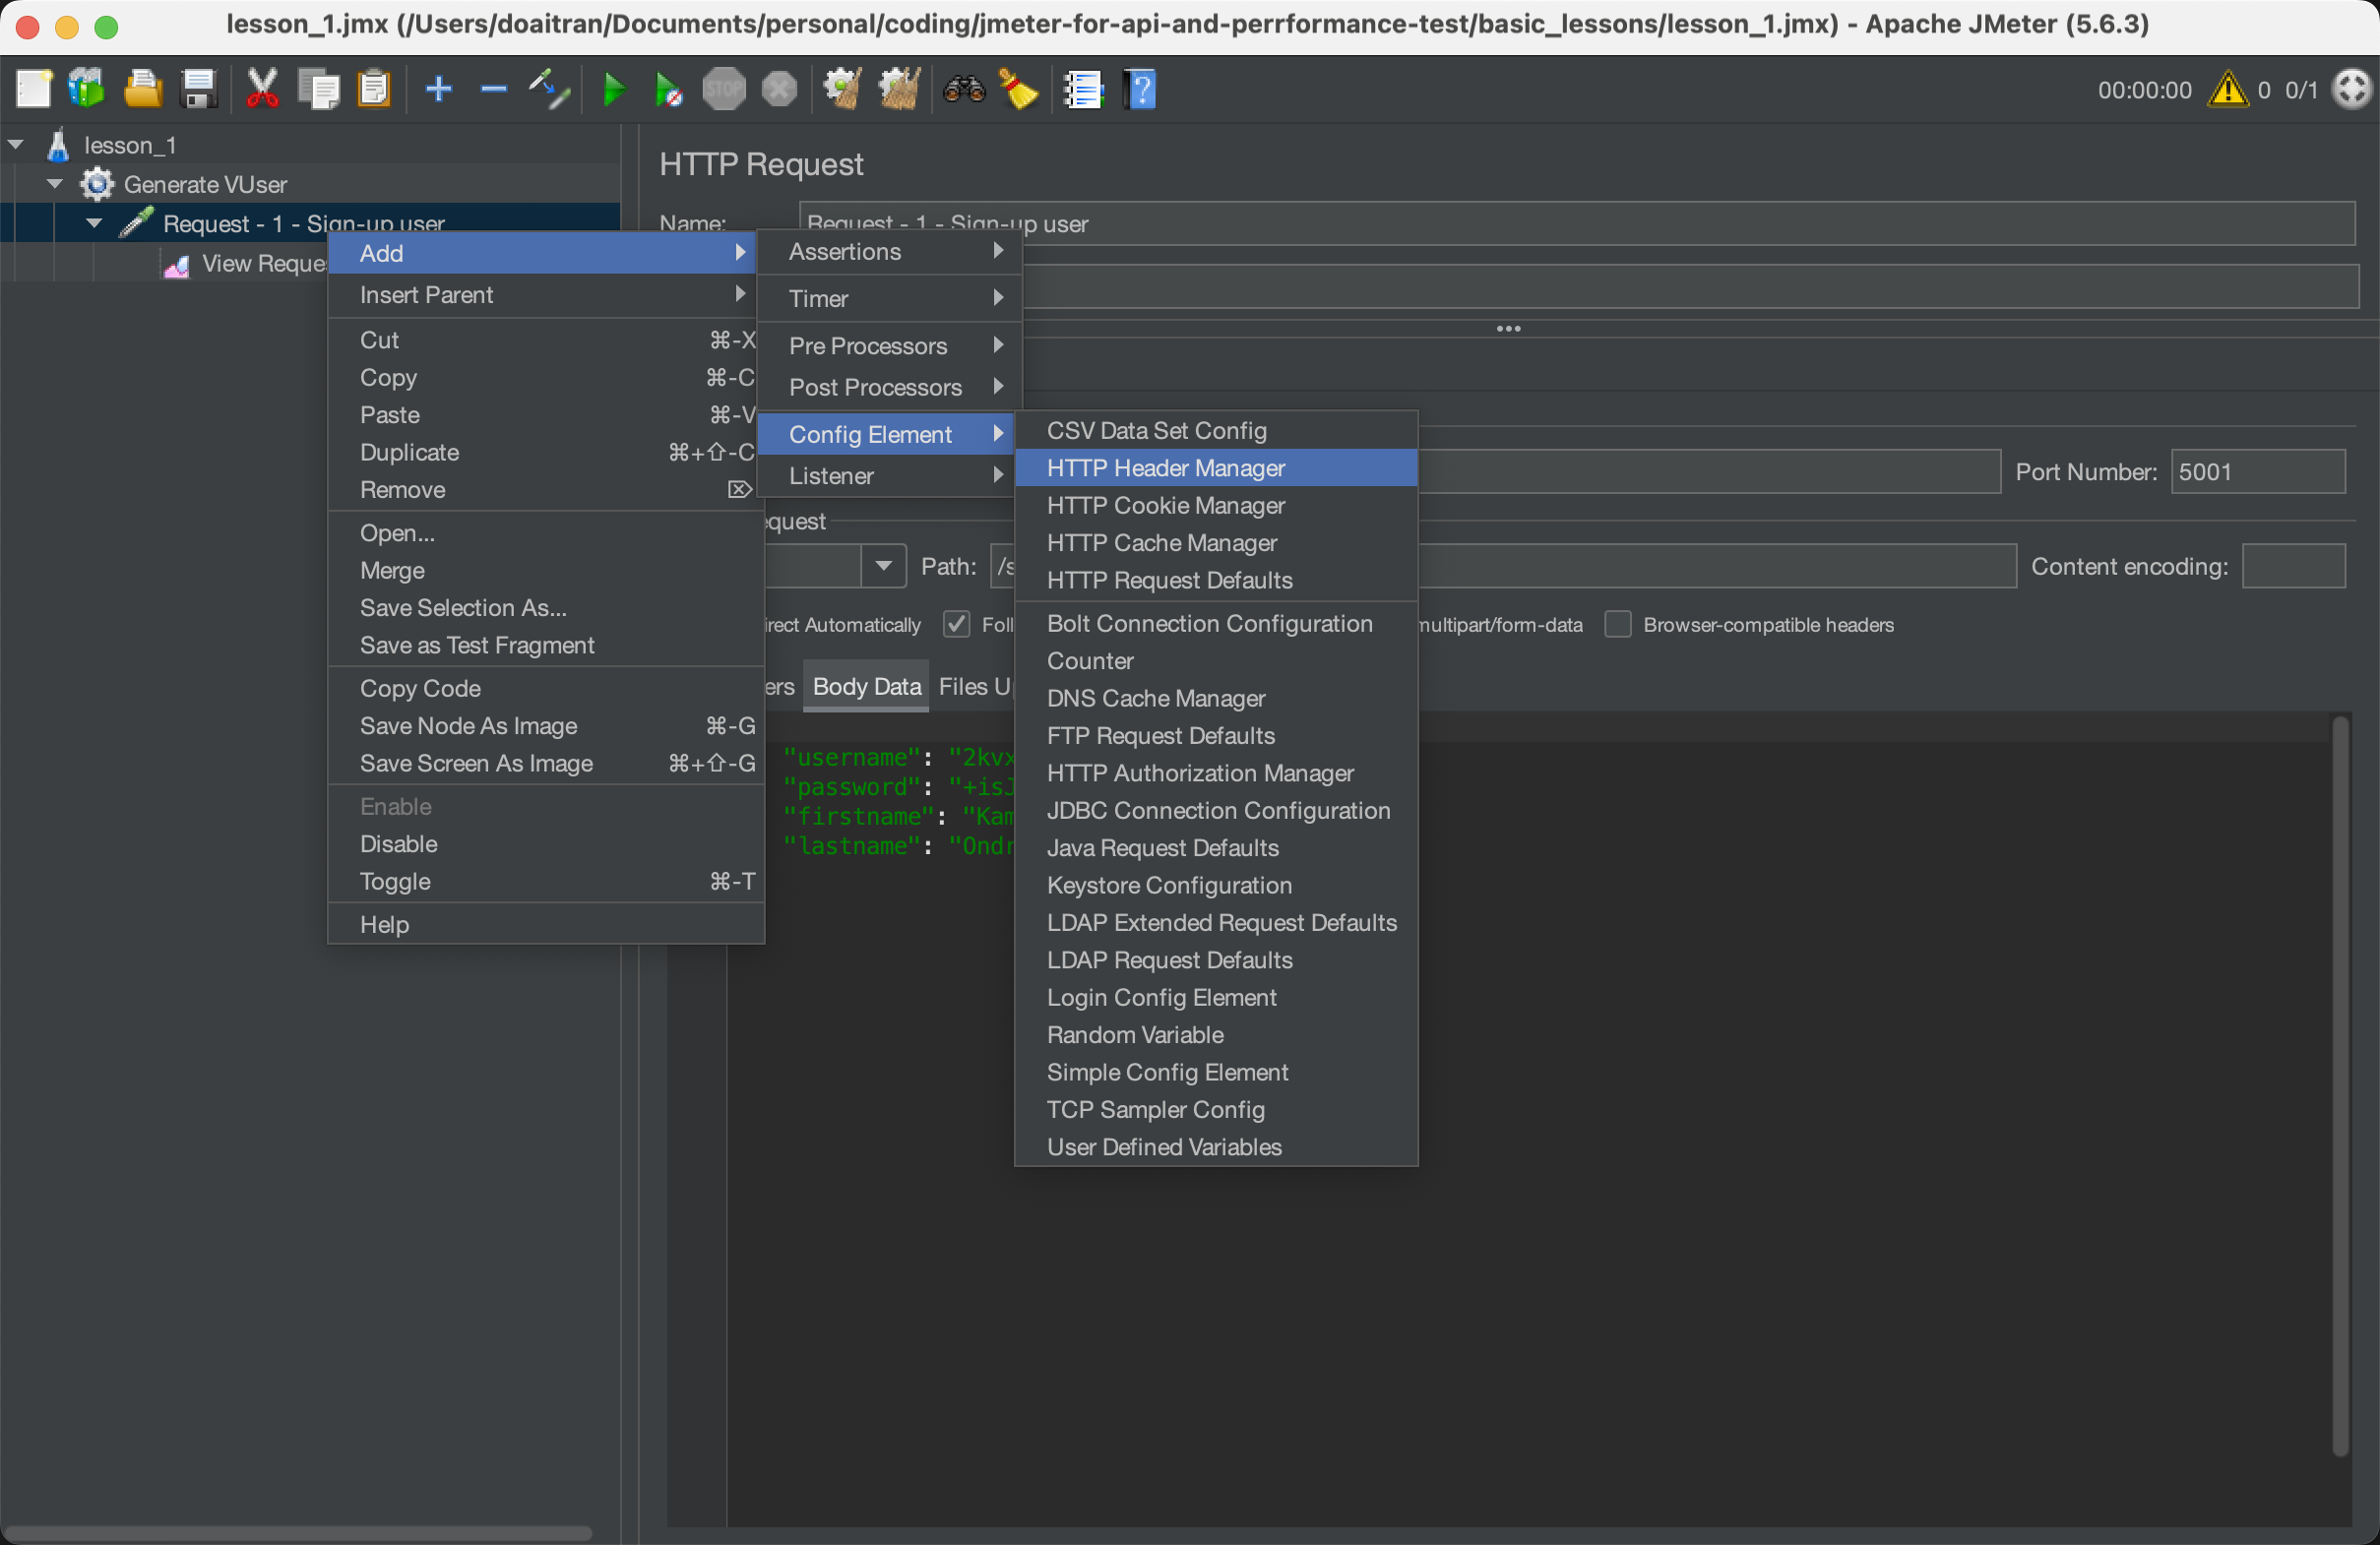
- Add a simple config Element
In order to configure the HTTP header of our HTTP sampler request, we need to add a config Element for configuring HTTP header.
- Right click on HTTP Sampler request.
- Select Add
- Select Config Element
- Select HTTP Header Manager
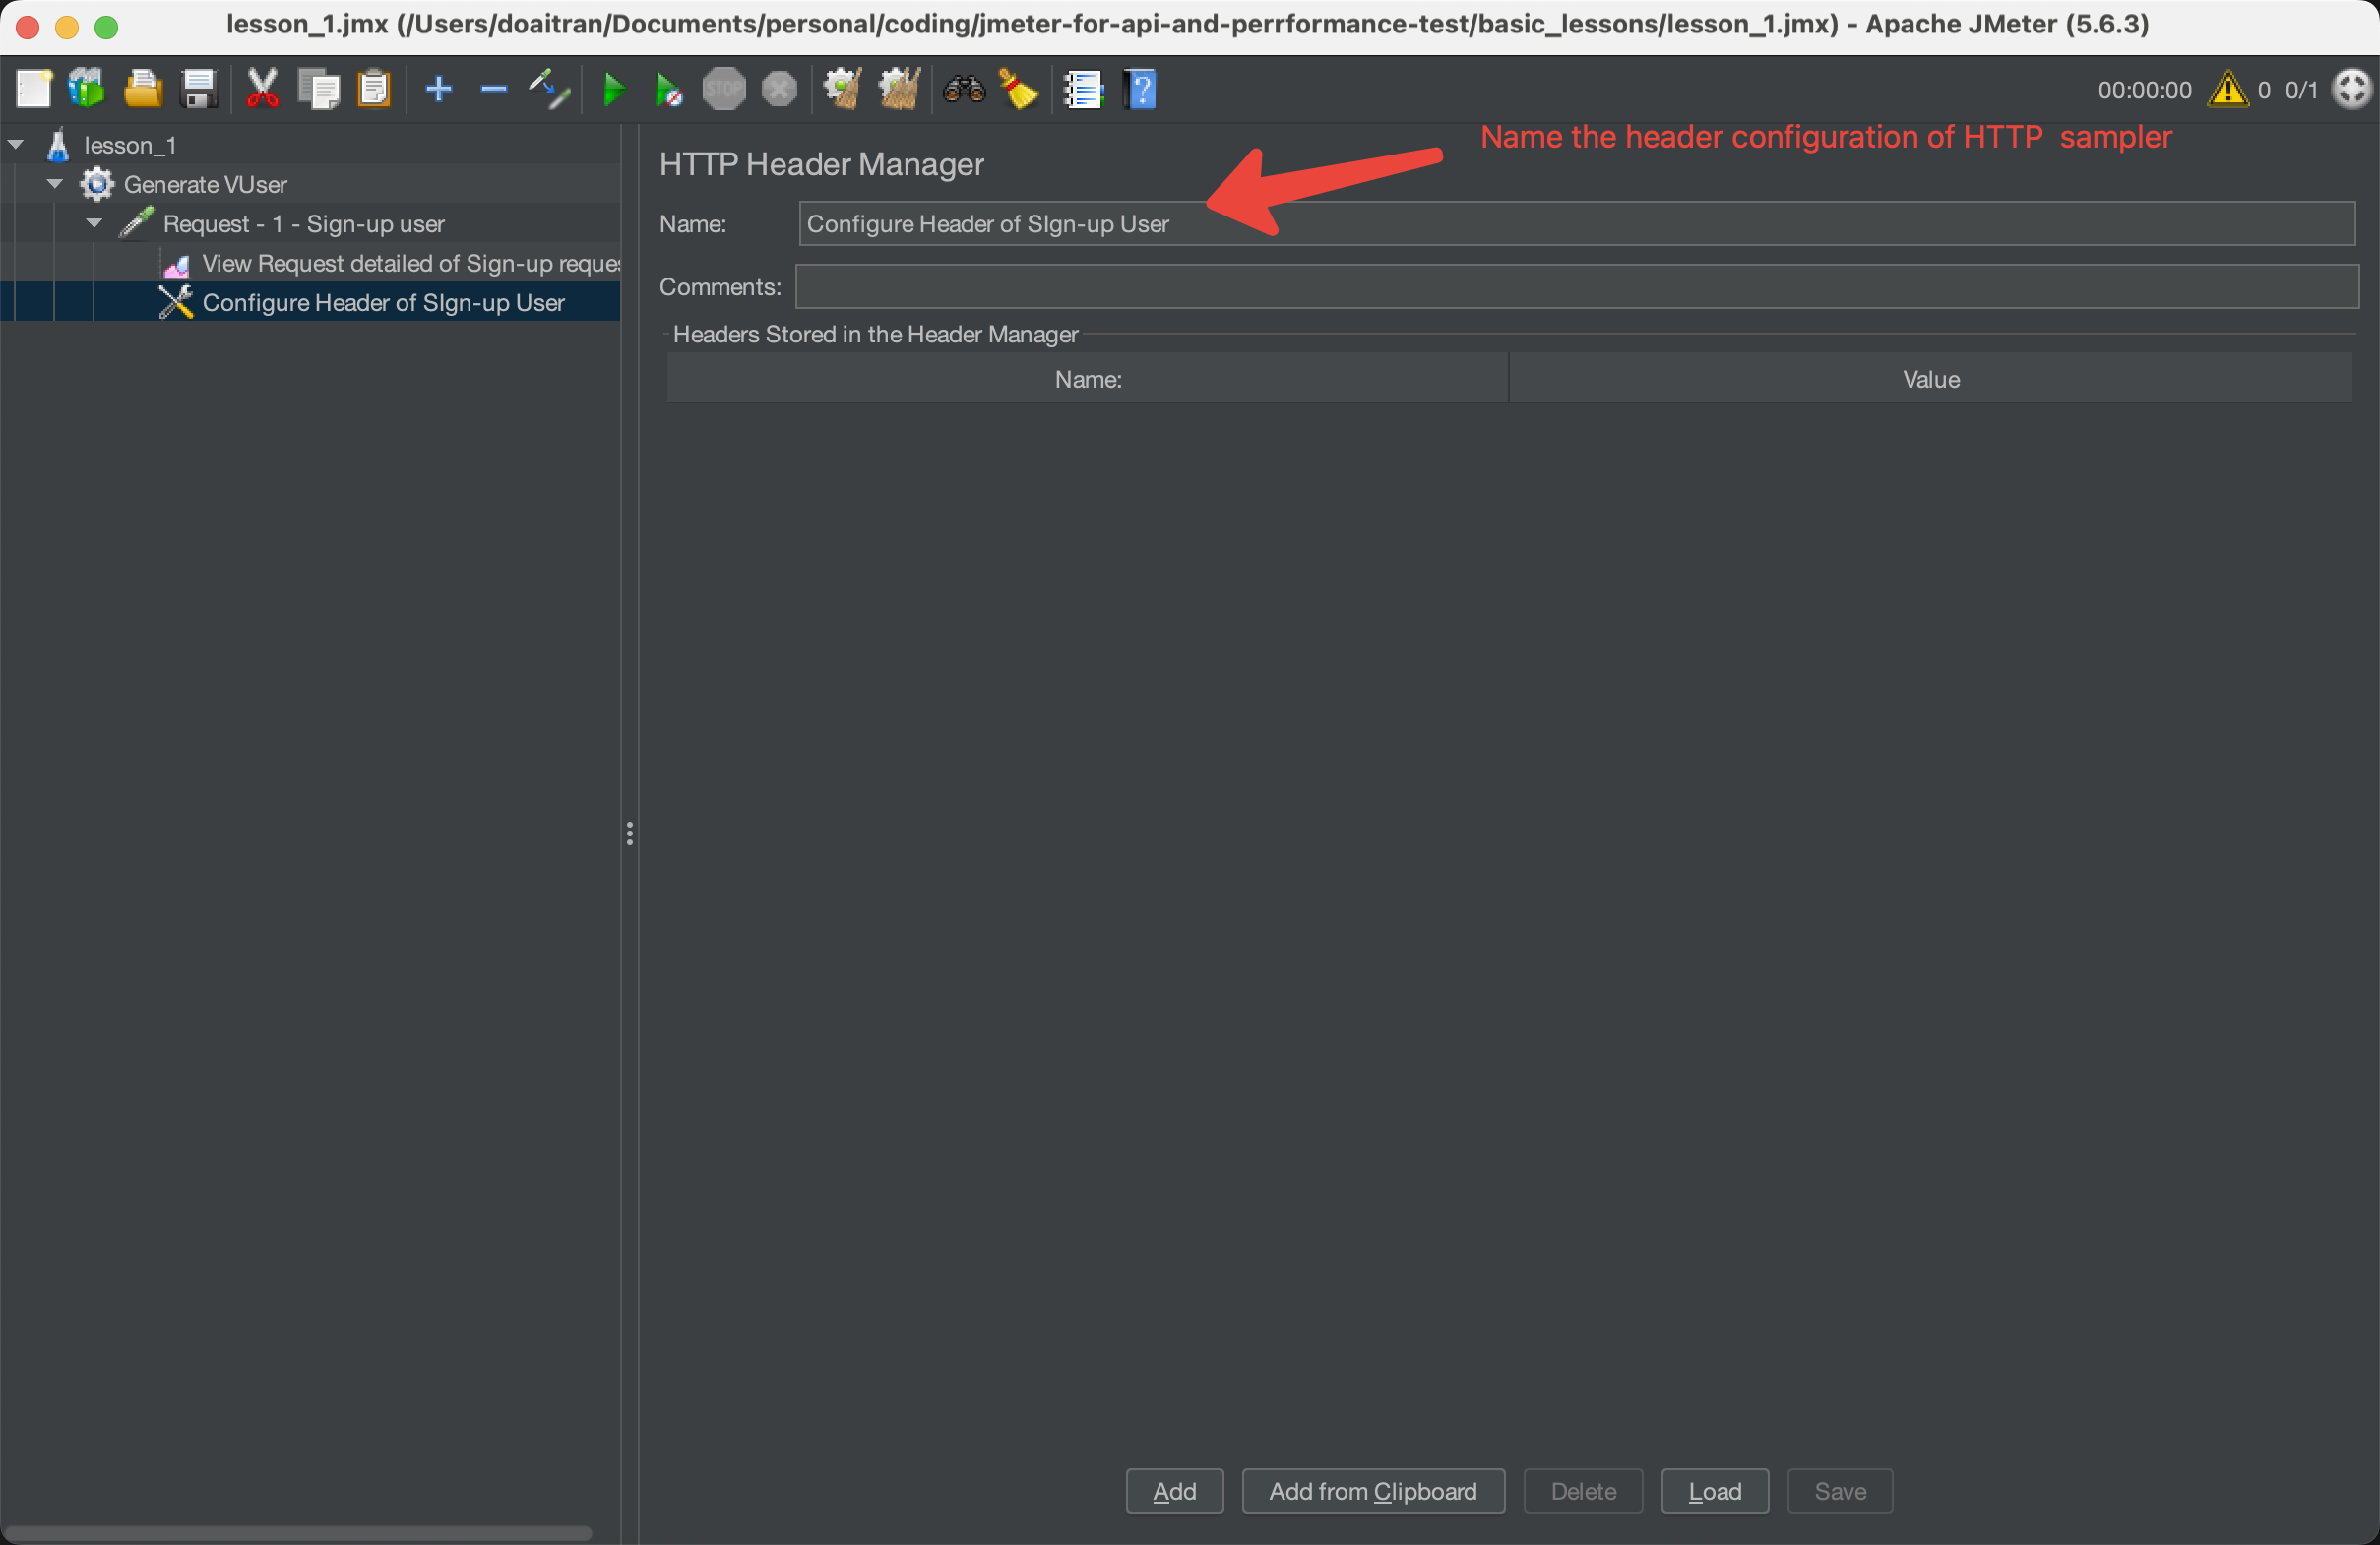
Click add Header value ‘Content-Type: application/json’ as below:
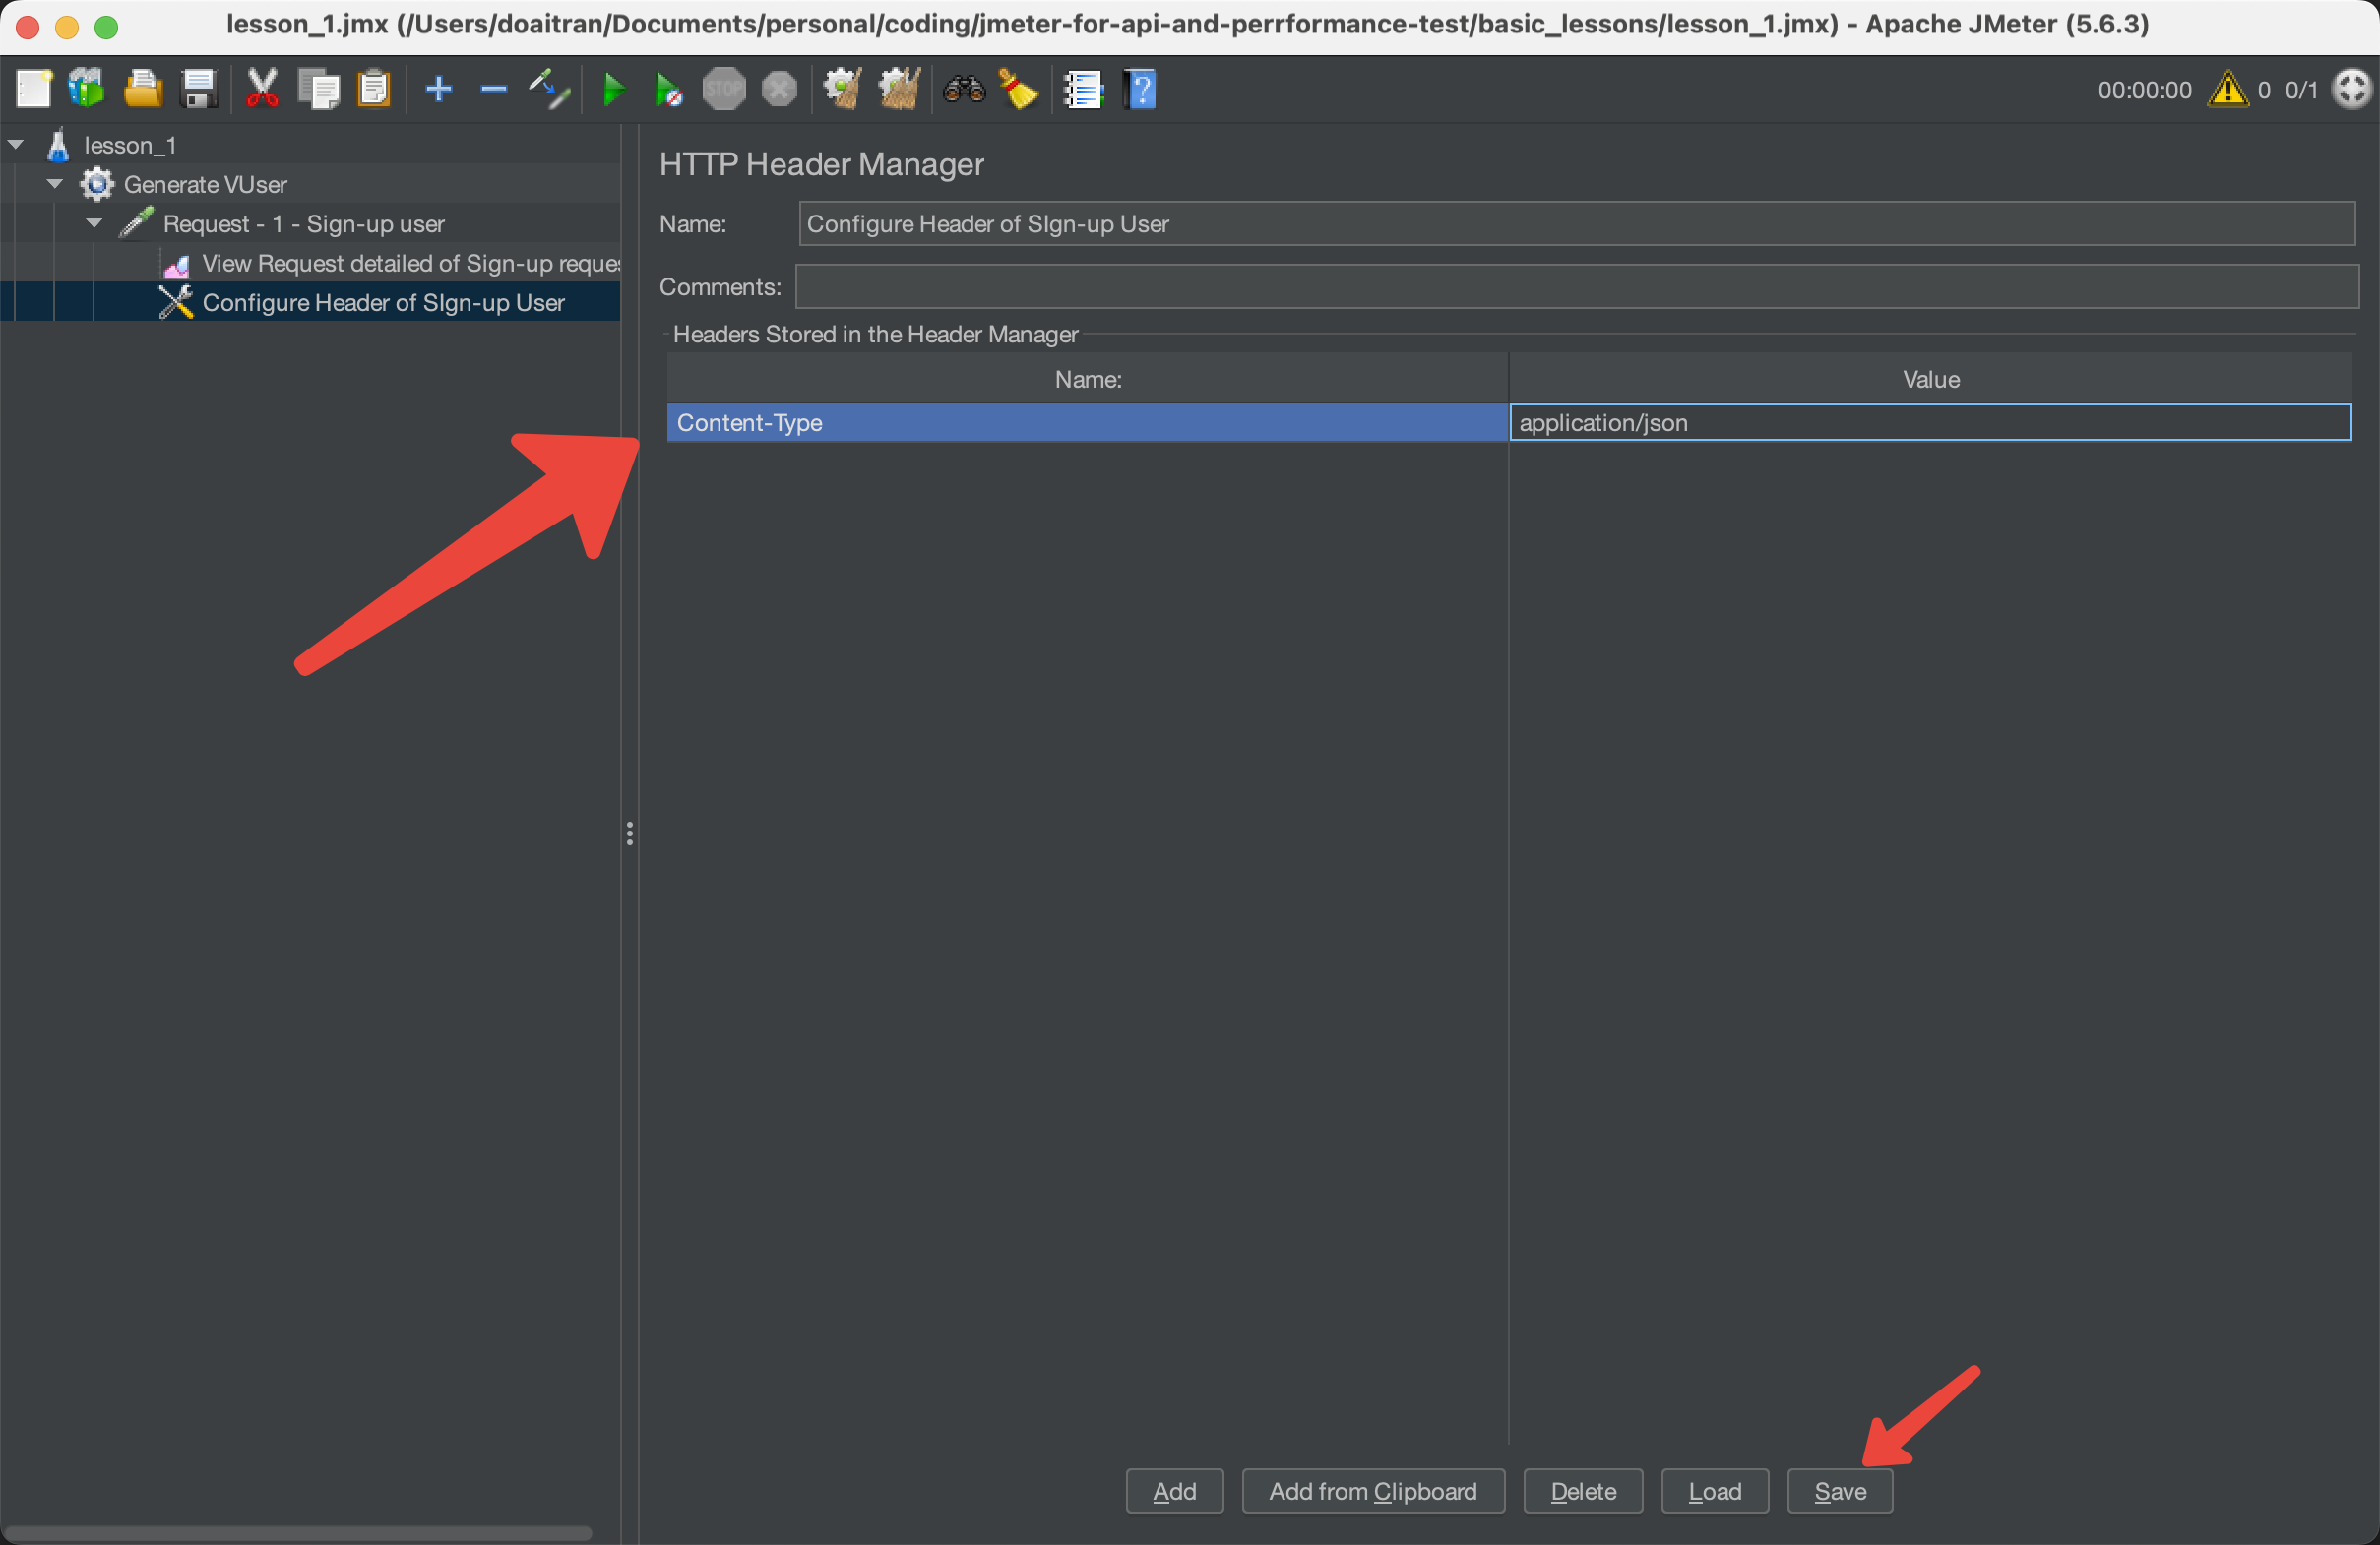
Save the configuration of header and trigger run again. We can see the result is successfully.
The 2nd request is successfully